

Beginner Read Introduction to eCommerce
Thinking about setting up an online shop? Read on to understand the basics of eCommerce and how it could benefit your organisation.

In this article
This article outlines the 11 most useful eCommerce metrics to help you understand your online shop and its performance.
eCommerce metrics are numbers and measures that help us understand how our online shop is performing. In a physical shop, a shop manager can see how customers behave – how many visit the shop, what they look at etc – but in the online world we need to use data to understand how our customers are behaving.
We can usually find this data in a couple of different places. Firstly, you may have an analytics platform such as Google Analytics installed, which can provide this data. This is generally the best source of data as it has the most extensive tracking and reporting. Secondly, some eCommerce platforms such as Shopify and Wix have a built-in analytics function, which will provide most of these metrics.
Understanding how many people are coming through the doors of your shop is vital. In your analytics dashboard you will typically be able to look at:
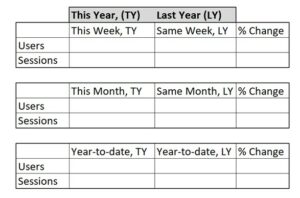
Website traffic
Looking at these metrics on a weekly or monthly basis will help you understand how your audience is growing.
This is a key metric which is vital for any online business. It helps us understand how good our website is at converting visits to your website into a successful sale. It is calculated using the following formula:
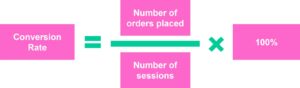
Conversion Rate
Do not be surprised if this percentage seems quite low – a typical good eCommerce conversion rate is between 2% and 3%. This means that for every 100 visits to your online shop, 2 or 3 of these may result in an actual purchase.
Conversion rates will tend to fluctuate and there are certain times when conversion rates will typically be stronger, including:
It is helpful to look at your data and understand if these apply to your organisation or business so that you can take advantage of these dynamics when scheduling marketing activity.
Like website traffic, conversion rate is a key headline metric for your website, and it is recommended you monitor this on a weekly, monthly and year-to-date basis.
The average order value tells us how much customers spend on average when they shop at our online shop. It is calculated using the following formula:
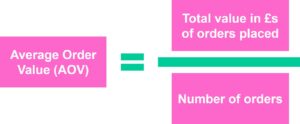
Average Order Value
It is a helpful metric as it can help you estimate how much new customers might spend with you and therefore how much you can afford to spend on marketing efforts to acquire them.
It is important to understand that your Average Order Value is heavily influenced by two things. Firstly, the price-mix of items for sale in your shop – if you sell a lot of high-price point items, then your AOV will be higher. Secondly, your AOV is directly related to your policy on delivery pricing. For example, if a retailer offers Free Delivery on all orders over say £50, this will exert an upward pull on their AOV, encouraging customers to spend more. If, however, this same retailer were to run a promotion offering Free Delivery for a limited time, they would see their AOV dramatically fall during this promotional period, as there would no longer be the incentive to spend more.
These first three eCommerce metrics:
come together to give you your headline eCommerce metrics. They describe how much revenue your online shop will generate. We can see this by looking at the equation below:
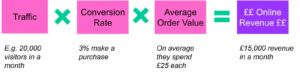
Online revenue
Once we understand our headline metrics, the next most useful eCommerce metrics involve peeling back the layers on these headline metrics and understanding how they vary along different dimensions.
We now turn our eye to look at how these three headline metrics – traffic, conversion rate and average order value – vary by location. For most UK-based organisations the majority of their web traffic will come from the UK, but your organisation might be picking up some traffic and even sales from outside the UK. It’s important to understand how significant this traffic is for your organisation and where it comes from. It’s most likely you will be picking up traffic from other English-language countries and close neighbours in Europe. Set out your data by country so you can easily compare your metrics. For example:
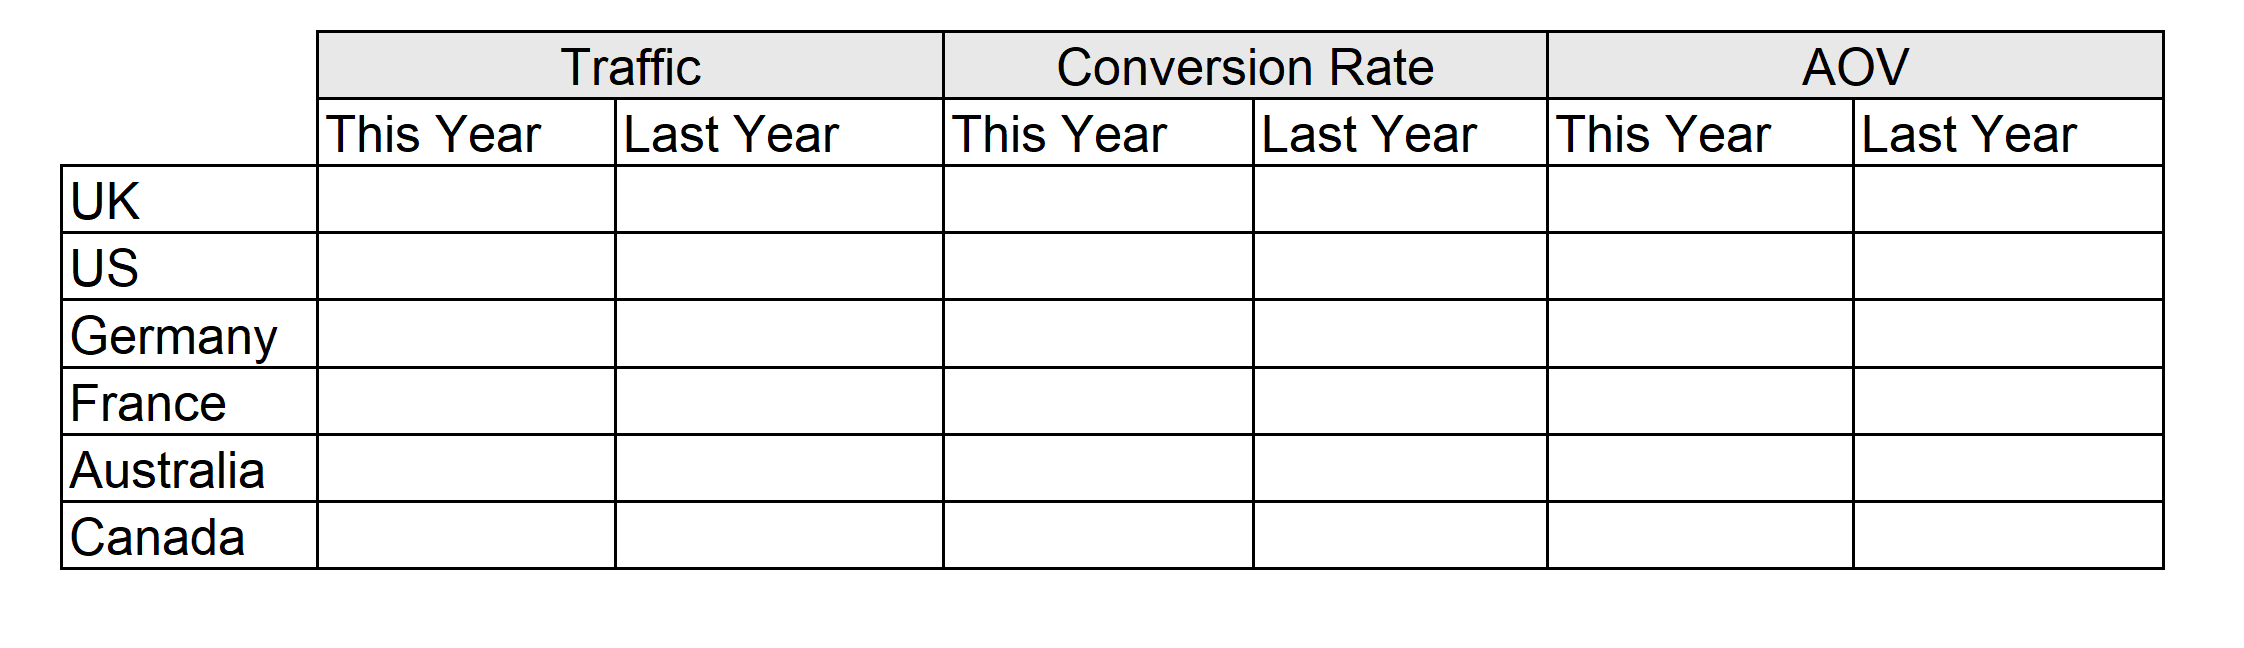
You will typically see that conversion rate outside of the UK, tends to be lower, but generally where customers are ordering from abroad, they tend to spend more to justify the postage costs, so typically there will be a higher average order value.
If you spot a significant chunk of traffic, say 10% or more, coming from a single country, it can be worth thinking about how you can improve the experience for customers shopping from that destination. Typically, this involves making sure your delivery information clearly addresses that country.
In a similar way to looking at how our headline metrics vary by location, we can also look at how our metrics vary by device. This gives us an understanding of how many visitors access the site by mobile, desktop or tablet, and how well the site performs for each of these devices. Set out your data by device so you can easily compare your metrics.
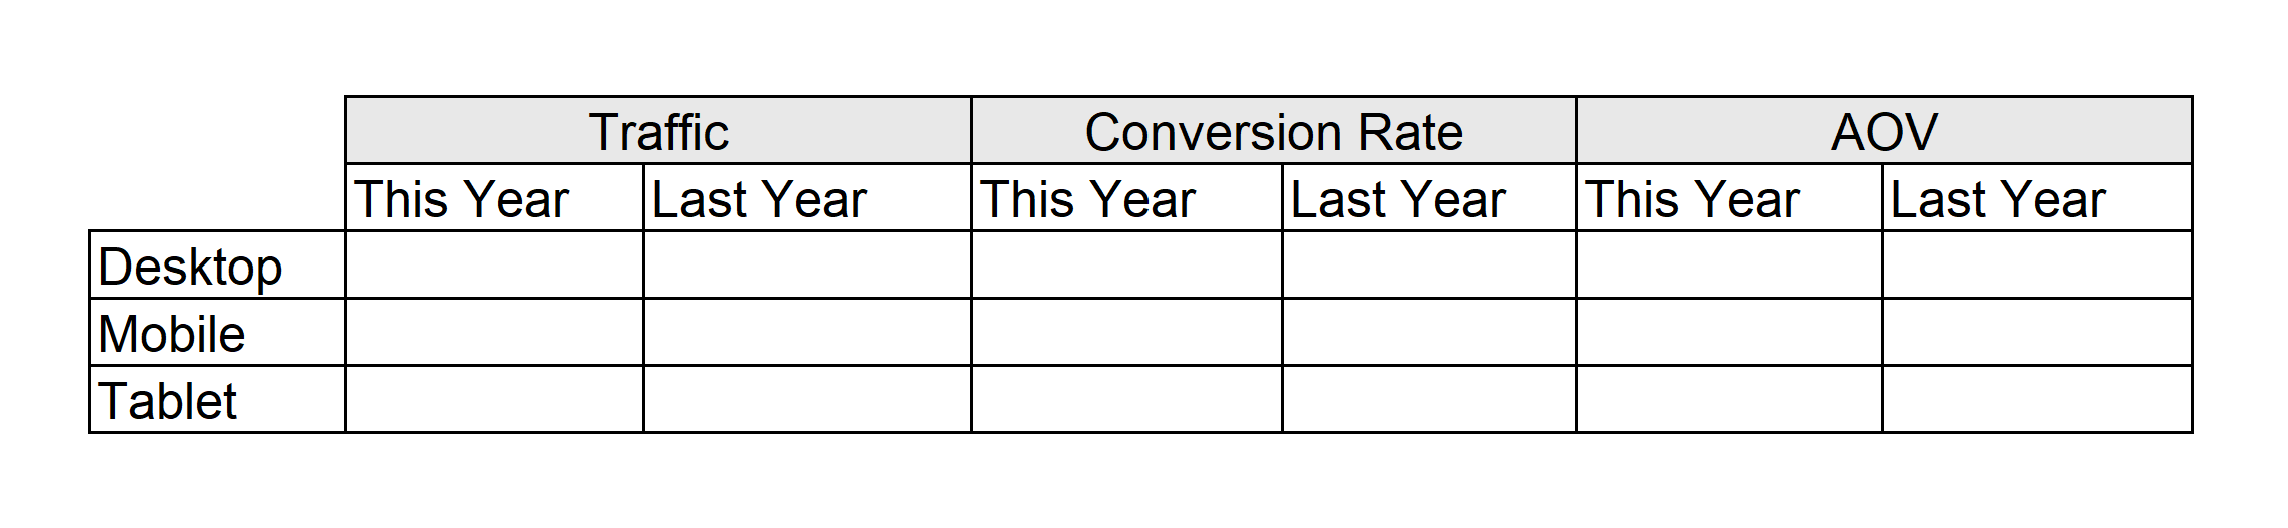
For many sites now, mobile traffic may account for more traffic than desktop. It’s important first to look at the traffic numbers and get a feel for how your traffic breaks down across devices and what your customers are using to access your site. This will help you be aware of how you need to be paying attention to the customer experience across both desktop and mobile devices.
The next area to turn your attention to is the conversion rate by device. It is typical for mobile conversion rate to lag behind desktop conversion rate. This is generally attributed to customers being more willing to browse on mobile but switching to desktop to make a purchase. That said, if you are seeing high mobile traffic and poor conversion rates, it is worth examining your mobile customer journey and identifying if there are specific barriers to conversion. This might include pop-ups that are hard to dismiss, buttons that can’t be reached, or functionality that is too small to engage with.
This is our third way of slicing our key eCommerce metrics and in many ways the most powerful as it can help us identify key strategies to grow our online sales. Traffic Source refers to the marketing channel that brought the visitor to the website. These include:
Again, we will look at our three headline metrics – website traffic, conversion rate and AOV to see how important each of these traffic sources are for our website and how they are performing.
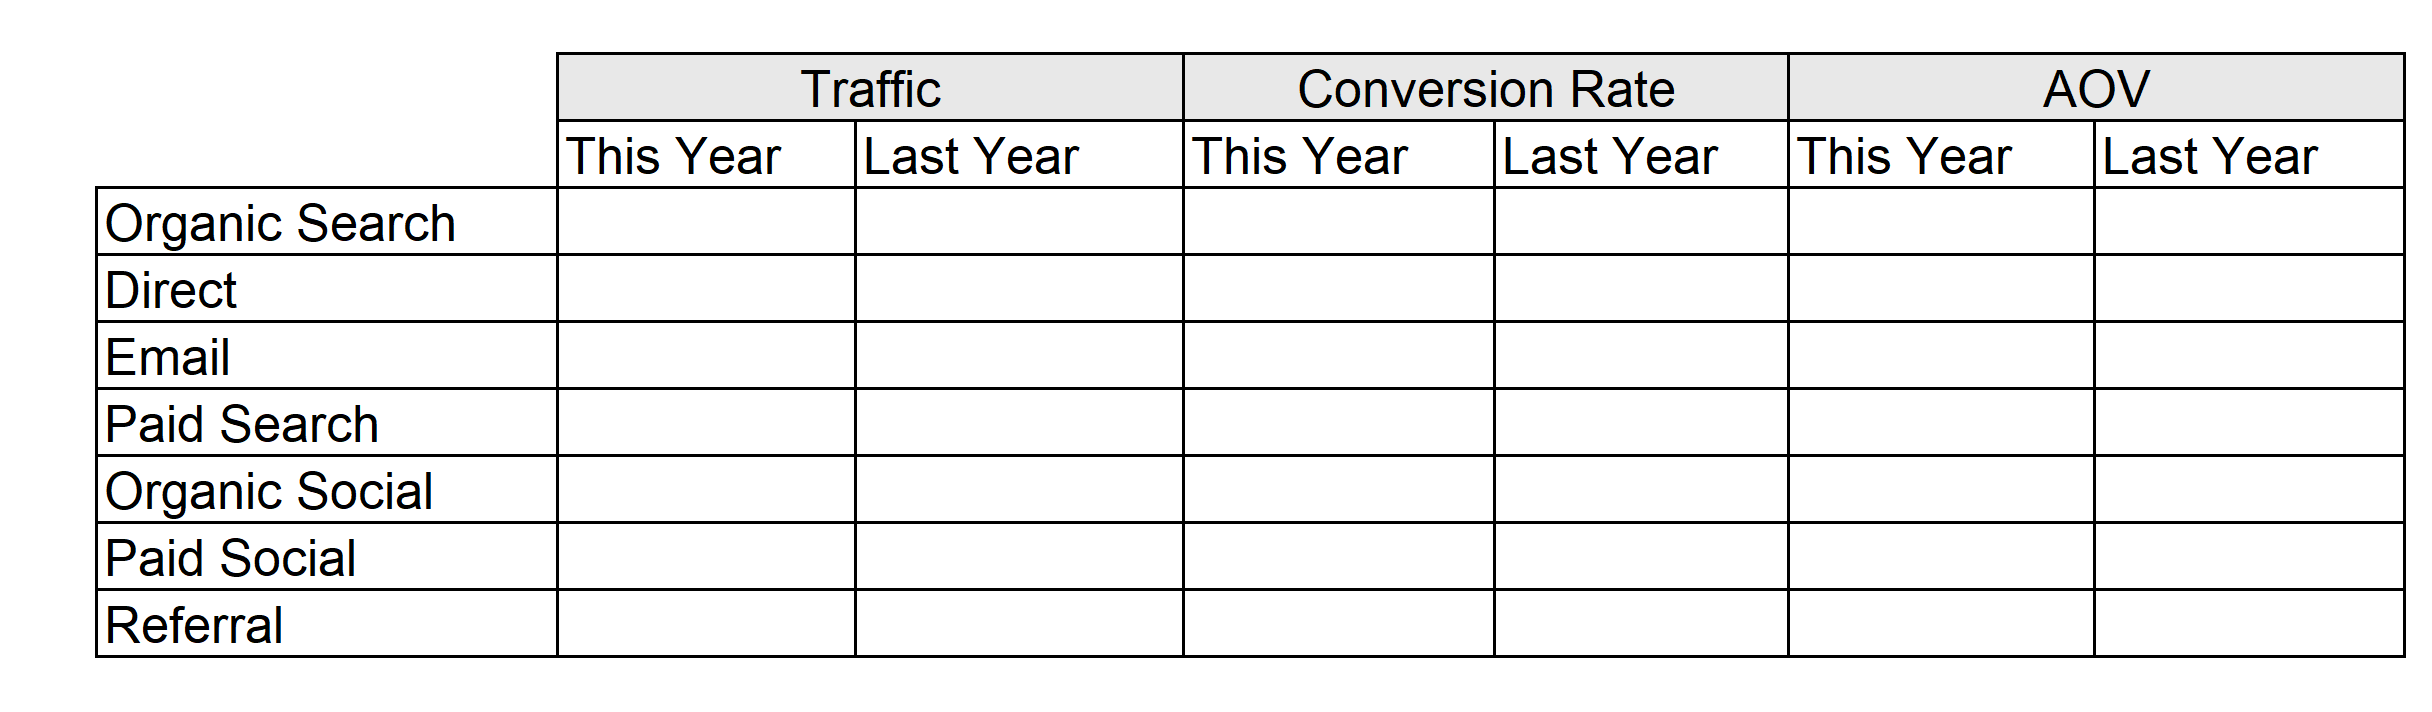
Looking at these metrics can help us understand how important each marketing channel is to the website and which channels might represent opportunities for growth.
Generally speaking, we expect Organic Search and Direct traffic to account for most traffic. These are both channels which are hard to directly influence and affect quickly. Organic Search results depend on how good our SEO – Search Engine Optimisation is; and Direct traffic is a result of brand awareness, both areas which must be consistently worked at over time to influence. Other channels however represent opportunities to more directly influence traffic to the website and grow eCommerce sales.
Email is often the hidden secret behind successful eCommerce. An online shop may look lovely, but unless we can drive some traffic to it, sales can languish. For many retailers, email traffic may account for 25% to 50% of all sales – this is a huge amount, and indicates why email marketing shouldn’t be overlooked. With this in mind, it’s worth looking at whether there’s room to grow your email traffic. Could you include products and offers from your online shop more frequently in your email marketing?
Paid Search is another channel which represents an opportunity for retailers to grow their traffic – in this case by advertising with search engines, mainly Google. Excitingly for not-for-profit organisations, Google offers Ad Grants which enable you to reach this traffic for free. What you will notice when you look at this traffic, is that it tends to have a much higher conversion rate. This is because this traffic has a much stronger ‘buying intent’ – these visitors have clicked on an advert highlighting a particular product they are interested in. Likewise, this is the case for Paid Social traffic, which is effectively advertising across social media platforms, such as Facebook and Instagram.
By looking at the profile of your traffic across these different marketing channels, you will start to get a feel for the ‘shape’ of your traffic. By monitoring it over time, looking at it weekly, monthly and on a year-to-date basis, you can see which marketing channels and activities are having the biggest impact on your online sales.
The next direction we turn our attention to is metrics which help us understand the performance of the products and product pages in our online shop.
Products matter – understanding which products resonate with your customers and which are selling through fast is vital for any online shop. Good practice is to look at your best-sellers on a weekly, monthly and year-to-date basis. It is important to look at both sales by value and by volume – as there may be some high-volume lower-priced lines that get overlooked if you just focus on value.
So, you want to improve the quality of your product listings – a noble aim, but if you have hundreds of lines of products listed on your website, it can be a daunting task. Knowing which products to focus on first is key and to do this we have to calculate the individual conversion rates of our products, using the following formula:
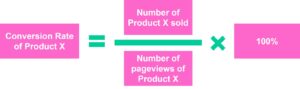
Individual Product Conversion Rates
For example, if 10 Museum T-Shirts are sold, and the Museum T-Shirt page is viewed 500 times, this gives a conversion rate of 2% for that product page.
If we then combine this product conversion rate, with data on which product pages have been viewed the most, we get some powerful information.
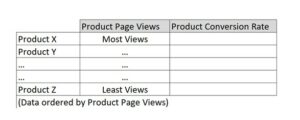
Comparison table ordered most to least views
We can order our data by product pages with the most views and then simply scan down the list of product conversion rates and spot which are lower and therefore suggest the product page could be improved. This might involve improving the imagery of the product or providing a more detailed product description.
We can also re-order this same data and identify any products which seem to be ‘hidden gems’. These are products that have strong conversion rates, but aren’t attracting many page views. To do this we would re-order our data by product conversion rate, from high to low.
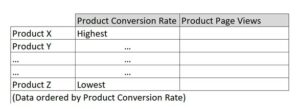
Comparison table ordered highest to lowest conversion rate
Then, as before, we can scan down the list and spot if there are high-converting products which are receiving fewer page views. If this is the case, we can consider if there are ways to feature this product more prominently, for example in a homepage banner, in email marketing or social media posts.
Finally, the last 3 metrics we will consider are the big picture metrics which will help you understand the long-term health of your online shop.
Acquiring customers is hard work – it involves time and potentially marketing budget to attract customers to your website. Obviously it’s great news when this marketing effort pays off and the visitor to your website converts into a paying customer. But what’s even better than that, is when that paying customer returns again in the future!
Your returning customer rate is calculated using the following equation:
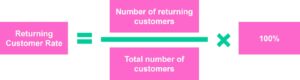
Returning Customer Rate
One question that often gets asked is ‘what is a good returning customer rate?’. This is a tricky one to answer for a couple of reasons. Firstly, by definition if your returning customer rates was 100%, by definition this would mean your online shop isn’t picking up any NEW customers – which is clearly not a healthy situation. Secondly, there are certain times when I would expect a much higher rate of returning customers – for example on a day a newsletter had gone out to my existing customer database – around this time I should naturally see a higher rate of returning customers. Instead I recommend that organisations are conscious of what marketing activity they are operating and look for a healthy balance between returning and new customers, which generally means a returning customer rate of anywhere between 20 and 50%.
This is an important metric to help you understand how effective your marketing campaigns are and how much it costs your organisation to bring in new customers to your online shop.
It isn’t a metric that your analytics platform will generate for you, but it is a metric which you will need to calculate for your organisation. It is calculated using the following formula:
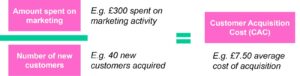
Customer Acquisition Cost
Following the example above, we would add up how much the organisation had spent on online advertising campaigns in a month – for example across pay-per-click campaigns on Google, or paid-social campaigns on Facebook, Instagram or Twitter. We would then take this total marketing spend, e.g. £300 in a month and divide by the number of new customers we had acquired in that month, e.g. 40 new customers. This would give us an average cost of £7.50 to acquire a new customer.
This is a helpful metric, as we can compare it to our average order value, and it can give us a sense of how our marketing costs add-up versus the revenue an average order brings in.
Many businesses incur high customer acquisition costs, often spending more on acquiring the customer, than the customer spends in their initial order. This may sound counter-intuitive; why as an online business, would I spend more on marketing costs to acquire the customer, than the customer will spend on an average order? To understand how this can make good business sense, we need to understand one last eCommerce metric, Customer Lifetime Value.
This is another metric that isn’t generated by your analytics dashboard – but it is one you have to calculate based on different data sources from within your organisation. The metric helps us understand how much revenue the average customer is worth to our organisation over the lifespan of their relationship with our organisation. Essentially this helps us to put a £ value on the benefit of returning customers and helps us to understand why a business might be prepared to spend more on acquiring a new customer, than their initial first order is worth.
The formula we use to calculate Customer Lifetime Value is as follows:
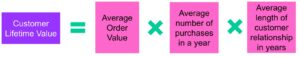
Customer Lifetime Value
Getting to these numbers can be challenging as it will require manual analysis of your order history, to determine how frequently customers order each year and how long a customer relationship can last for. It is however data worth pursuing, as ultimately it helps you understand how aggressively you can invest in customer acquisition given the future value of the new customers you acquire.
It takes time to establish these metrics, but they are key to understanding your customers and helping your business or organisation prosper.
The Digital Culture Network is here to support you and your organisation. Our Tech Champions can provide free 1-2-1 support to all creative and cultural organisations and individuals who are in receipt of, or eligible for, Arts Council England funding. If you need help or would like to chat with us about any of the advice we have covered above, please get in touch. Sign up to our newsletter below and follow us on Twitter @ace_dcn for the latest updates.
Beginner Read Introduction to eCommerce
Thinking about setting up an online shop? Read on to understand the basics of eCommerce and how it could benefit your organisation.

Beginner Read How to audit your eCommerce website and improve your customer journey
In this article, we explain what the customer journey is and how it can be used to structure an audit of your eCommerce website. Follow this approach, and you should be able to identify opportunities to improve your customer journey and grow online revenue.

Beginner Read How to develop a ‘Pull’ eCommerce Strategy and unlock your online revenue growth
This article shows that by developing a ‘Pull’ eCommerce strategy, an organisation can put itself in a strong position to grow revenues and attract more customers.