Reporting in Google Analytics 4

Southbank Centre – Andreas Gursky, Photo: @ Andreas Gursky
Reporting in Google Analytics 4 (GA4) is split into three main areas – Reports, Explore and Advertising. In this article we will explain the data in each section and how each can be used to understand how your website is performing and what your users are doing.
Home section
When you initially log in to Google Analytics 4 you are taken to the GA4 Home page. This displays information cards with top level numbers of Users, Event counts, Conversion, Total users and Revenue (if you collect ecommerce data). Additionally you can see Realtime data, this shows how many Users were on your website in the last 30 minutes and where they are located.
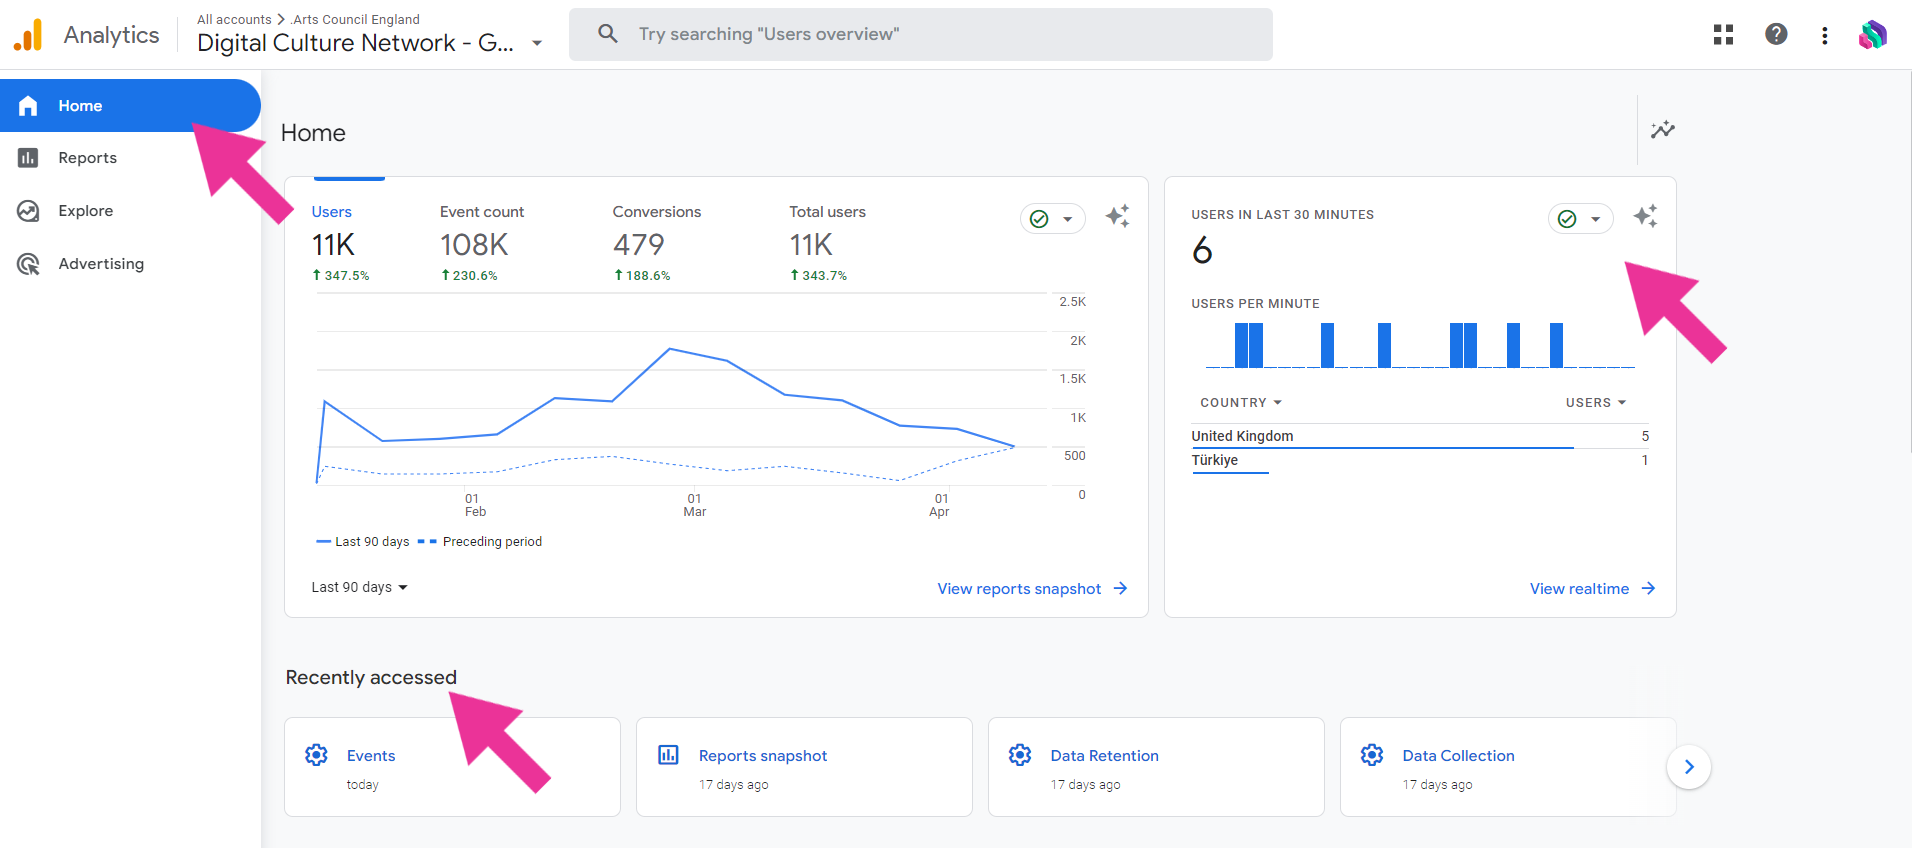
Further down the page you can see Recently accessed areas of GA4 so you can quickly get back to the areas of the interface you may have accessed in the past.
Insights & recommendations
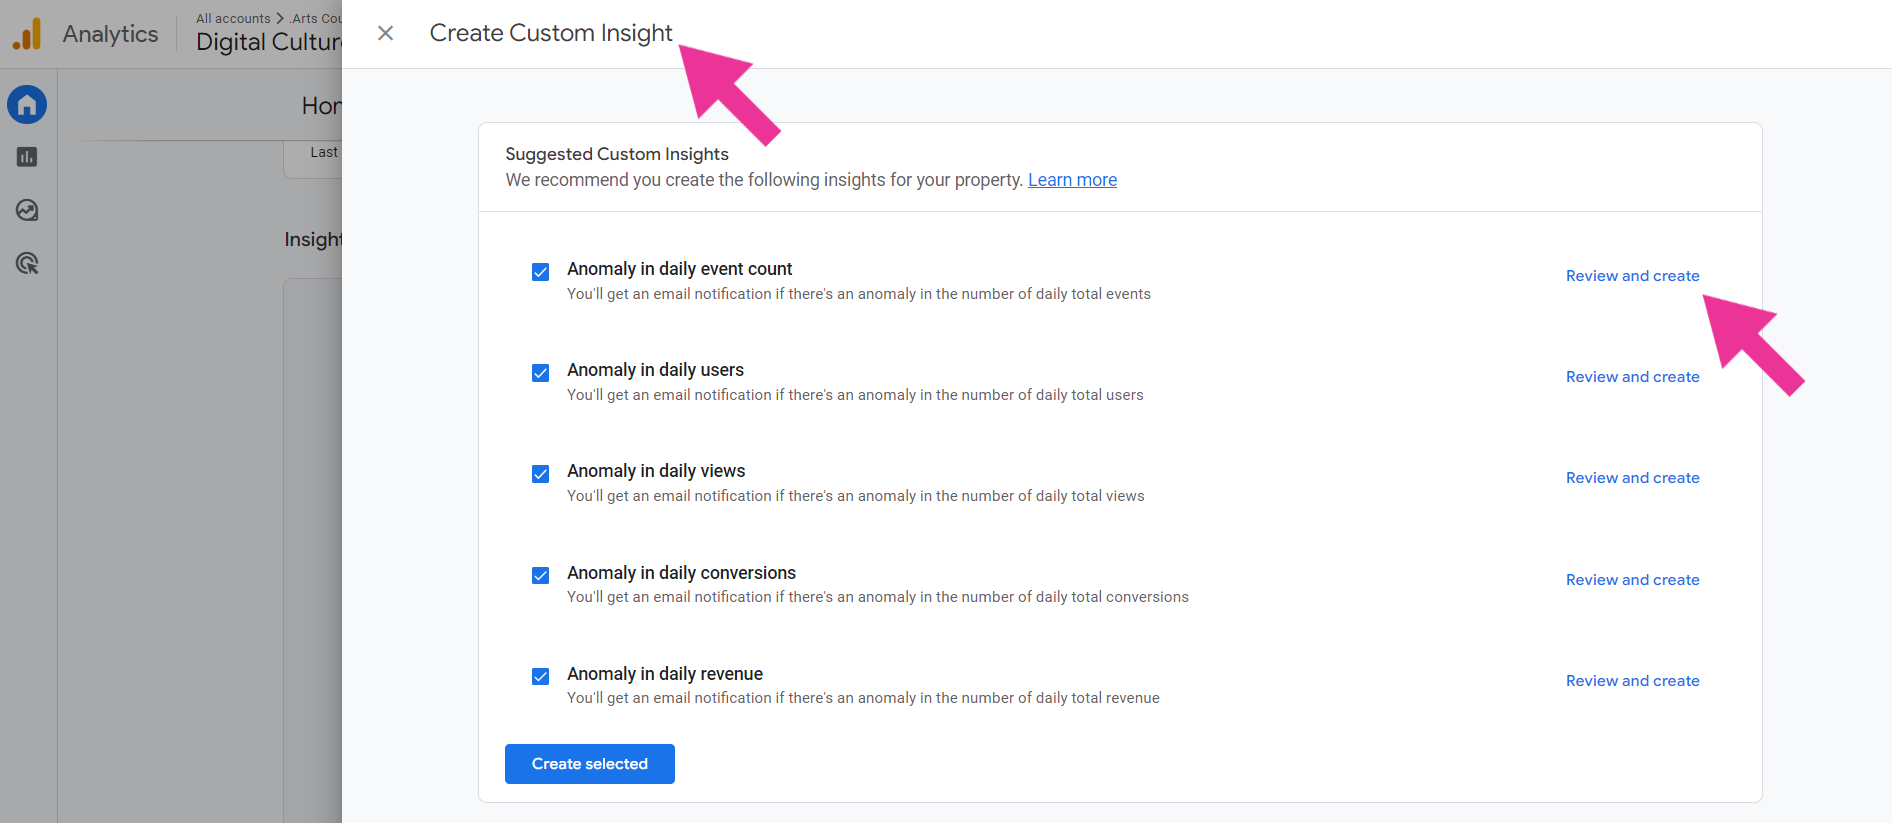
At the bottom of the Home page GA4 will display insights it thinks may be of interest. This section may be blank if you have limited traffic to the site and/or have no ecommerce tracking.
You can create you own custom insights to track on an hourly, daily, weekly or monthly basis and alert you by email of any significant changes. For example, a big drop in daily users may indicate a technical issue with the website. GA4 will email you so you can investigate further.
Reports section
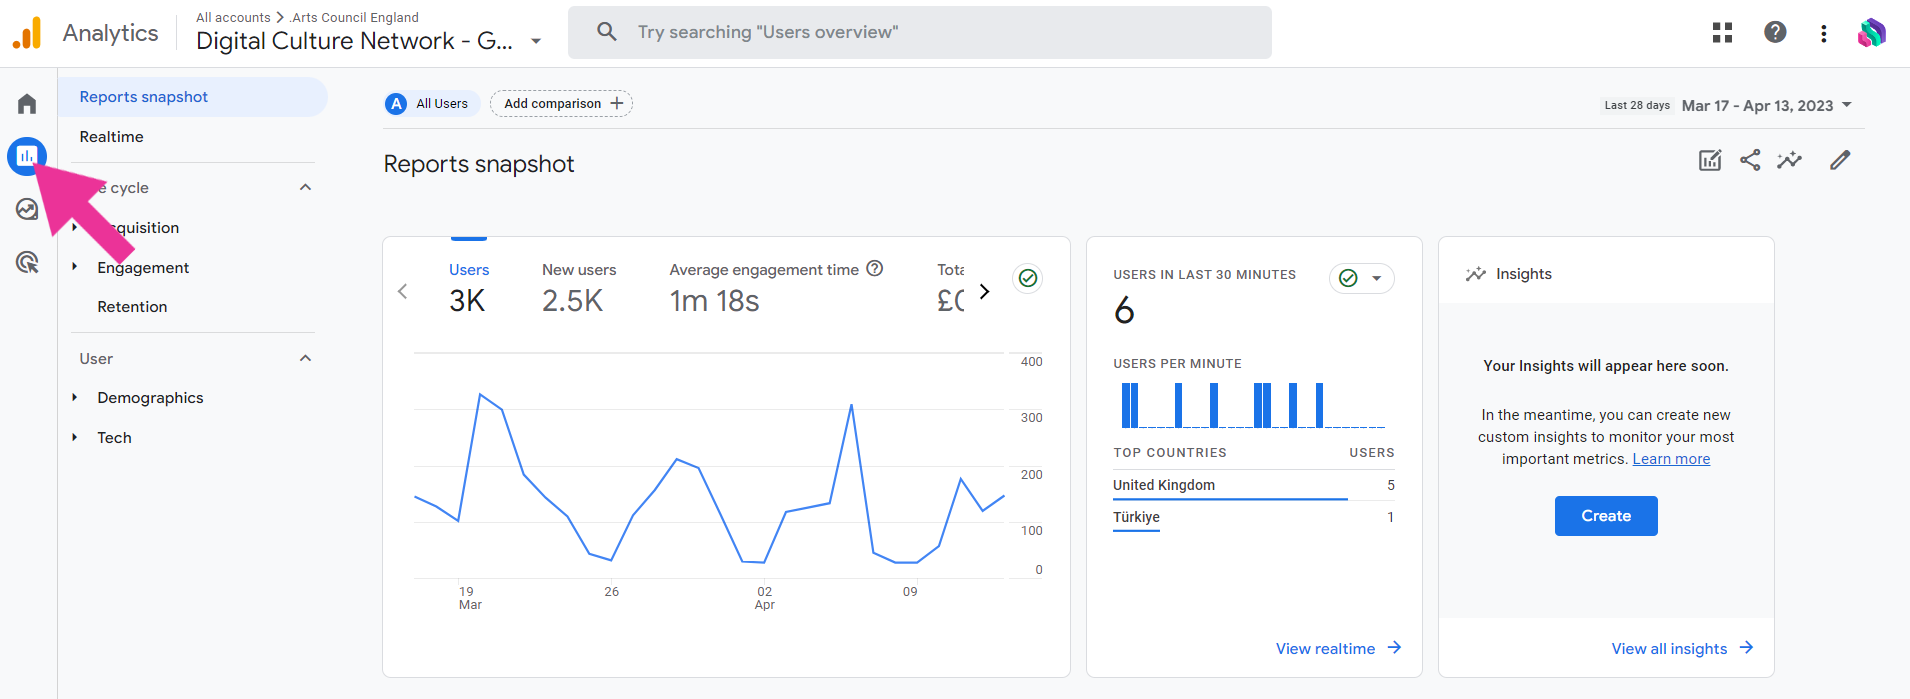
The Reports section of GA4 is a shop window of the data collected across different Events and Parameters as Dimensions (the category of information) and Metrics (the count).
Keep in mind there are limitations to the information available in the Reports section, to dig deeper into the data you may have to use the Explore section.
Customising the Reports list
When creating a new GA4 property you may have been asked your business objectives. The options selected here will determine which reports appear in the list within the Reports section.
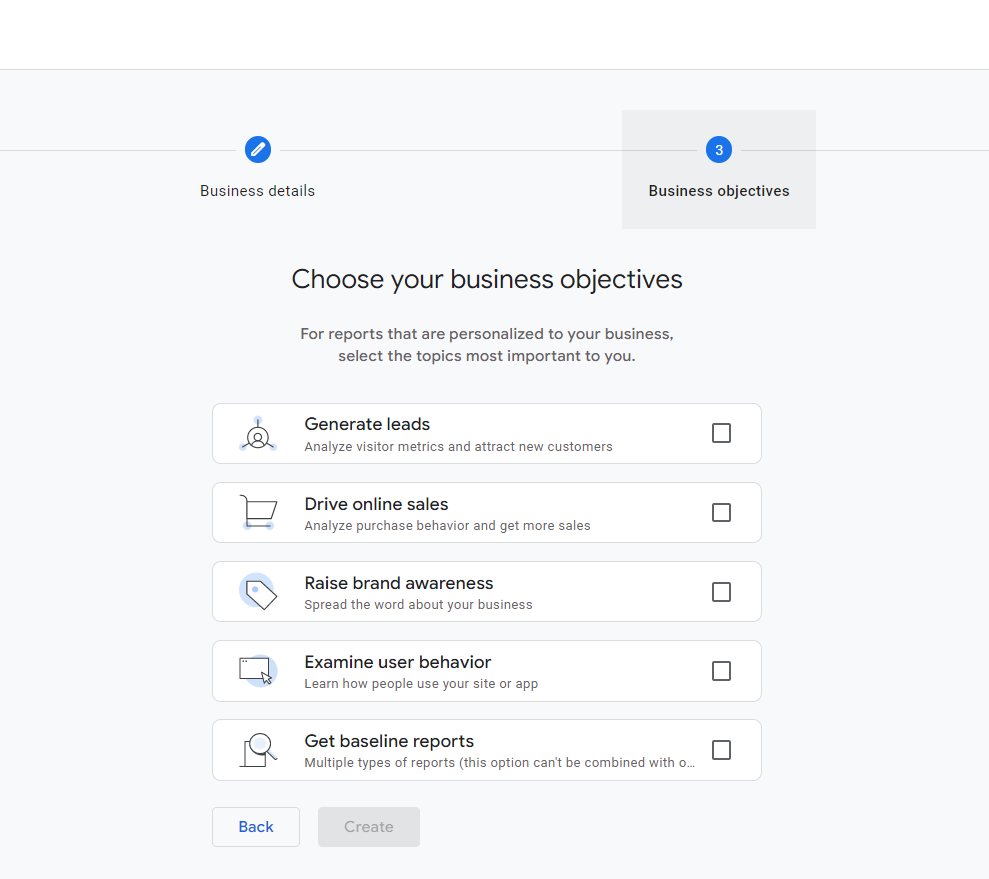
If you were to tick all of the top four options (not recommended), your Reports list would be structured with the following list on the left side:
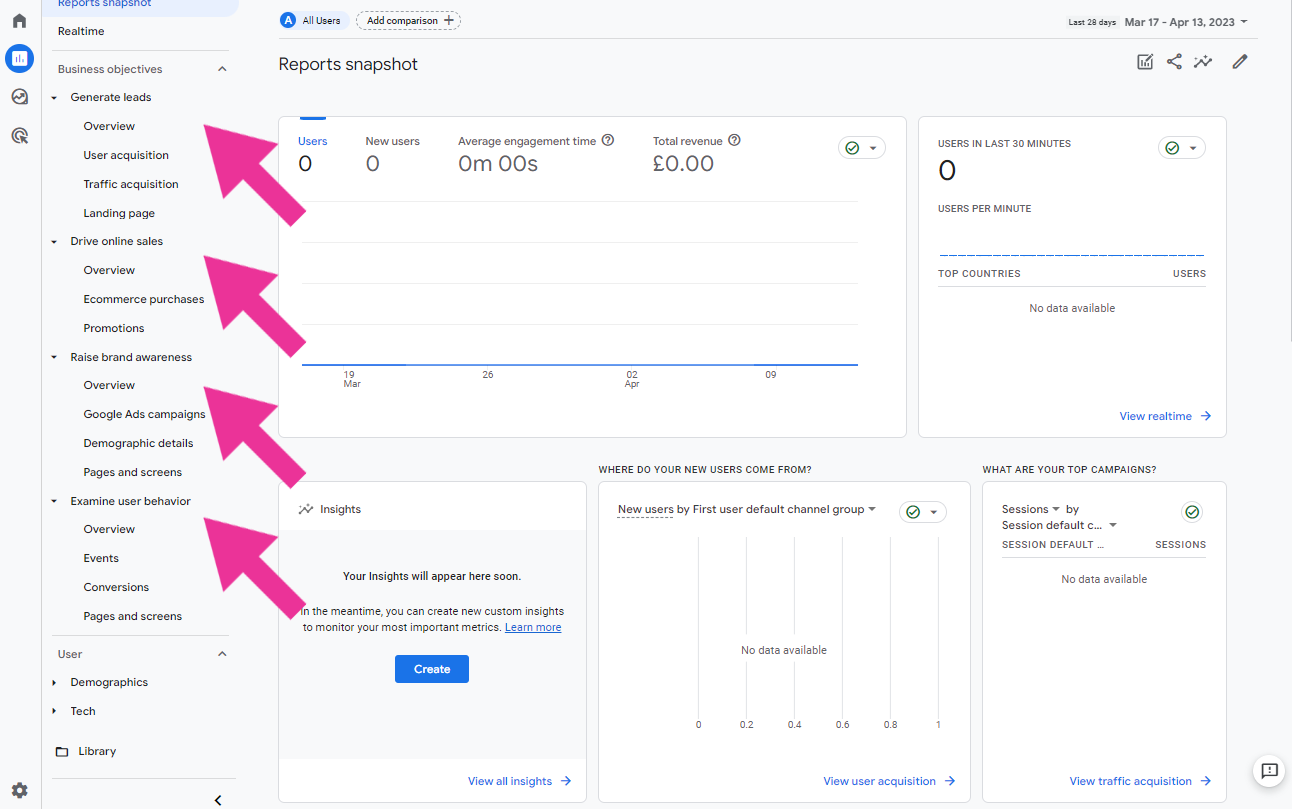
At the end of the list is a folder icon and Library. This is where you can customise the list – adding, renaming and removing reports at any time.
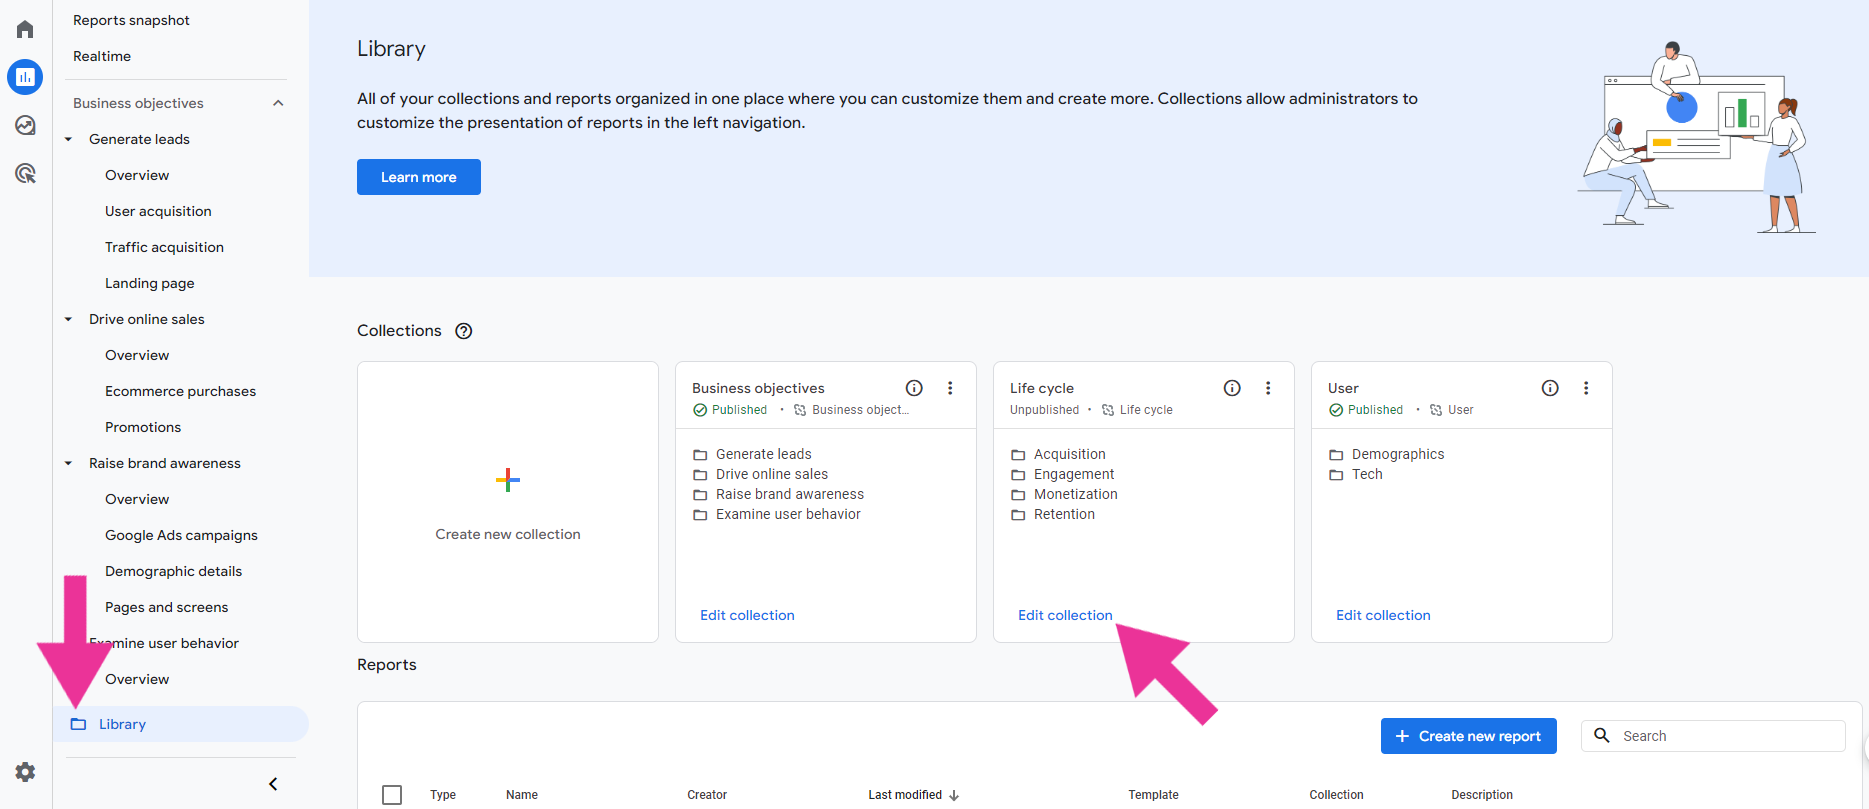
Reports sit within Topics, which then sit in a Collection. You are able to add new Collections, Topics and Reports here or remove them completely.
As an example, at the Digital Culture Network we have no need for the Monetisation reports so have removed them from the Life Cycle Collection in our GA4 property.
Navigating Reports
As the Reports section is fully customisable, the naming and placement of the Collections, Topics and Reports in your GA4 account may be very different from other accounts. It is up to you to decide what it is you need to know and what would be useful for ongoing reporting and analysis.
In this section we will talk through some of the reports available in the list if your Property has been set up for some time, or you have chosen the Get baseline reports from the business objective options when creating the account.
Example report: Traffic acquisition
The traffic acquisition report gives information about how your Users found your website every time they come back to your website. You are able to change the date range on this and any other report in the Reports section using the date picker in the top right corner.
The report will show GA4’s attempt at categorising the traffic into one of it’s default channel groups. The report will show a time series chart, a bar chart, and a table of information about the different channels. The table displays a range of dimensions and their associated metrics. You can learn more about what each dimension and metric means by hovering over each name or reading this Google support article.
A big change here from Universal Analytics (UA) is Users are the primary metric in GA4, these are Active Users (those with an engaged session – ones that lasted longer than 10 seconds, or had a conversion event, or had 2 or more page views), whereas UA displayed Total Users as it’s primary metric.
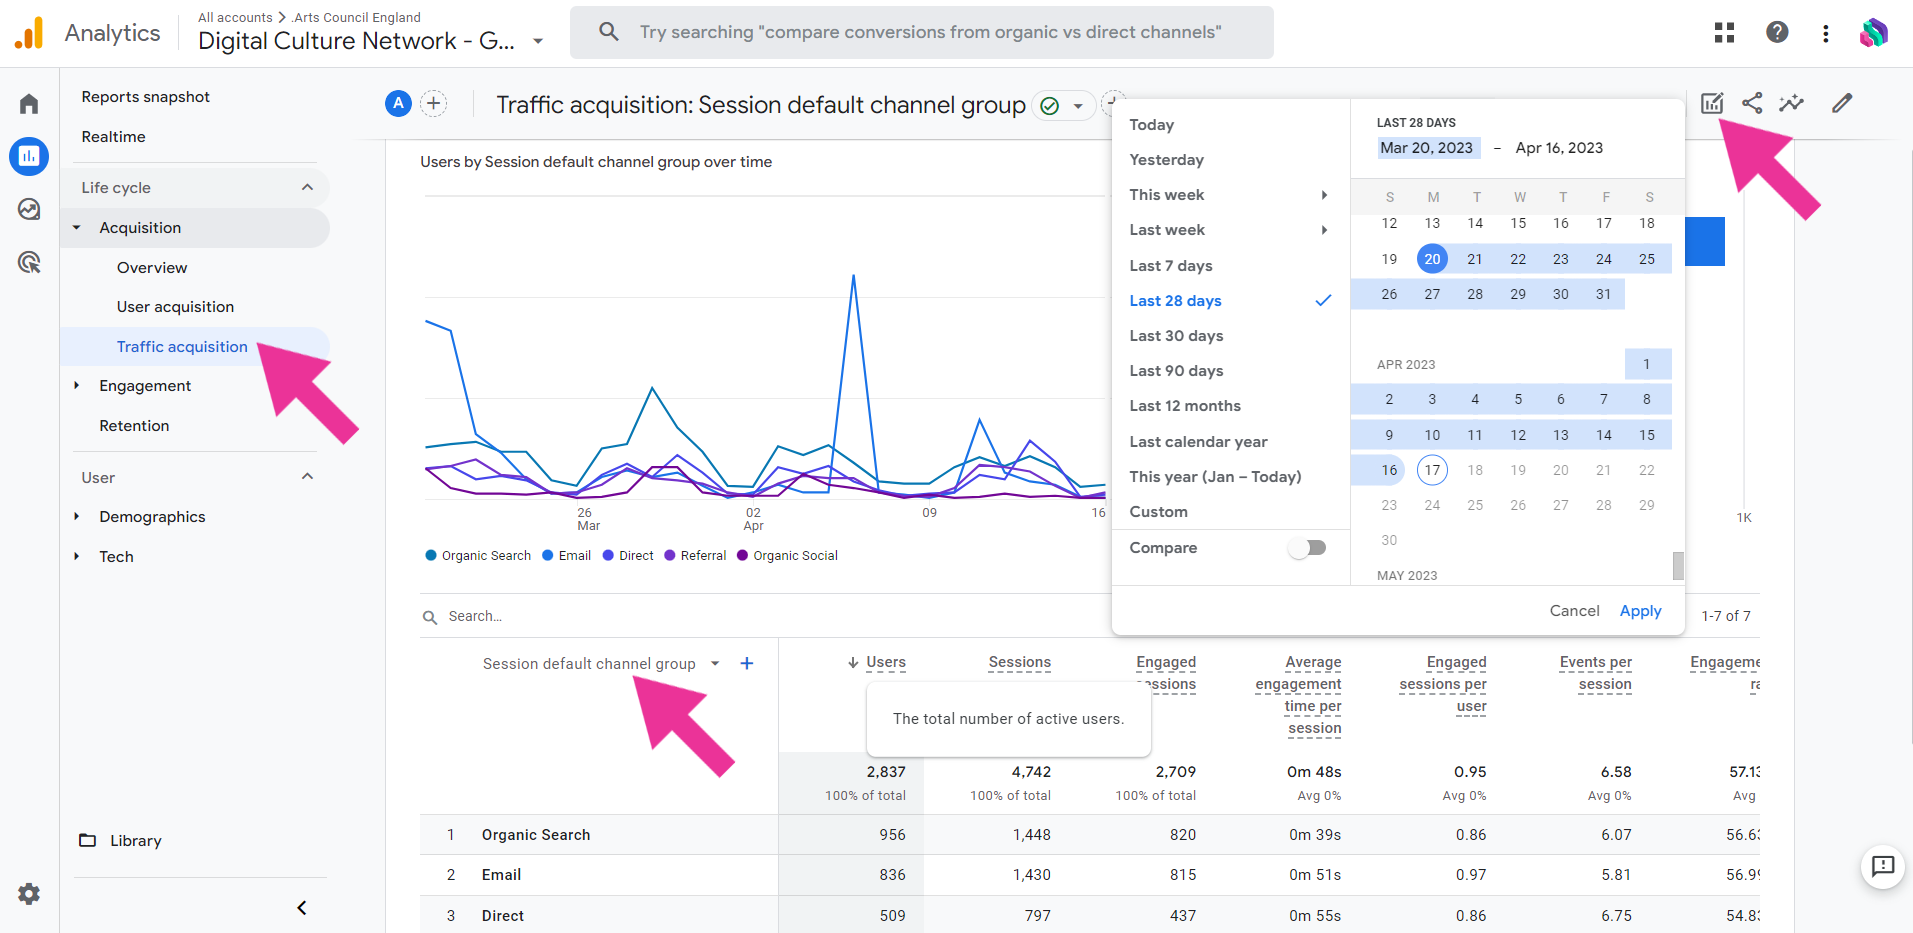
To find out more about the traffic in each channel you can use the dropdown or click the plus icon to add an additional column of information.
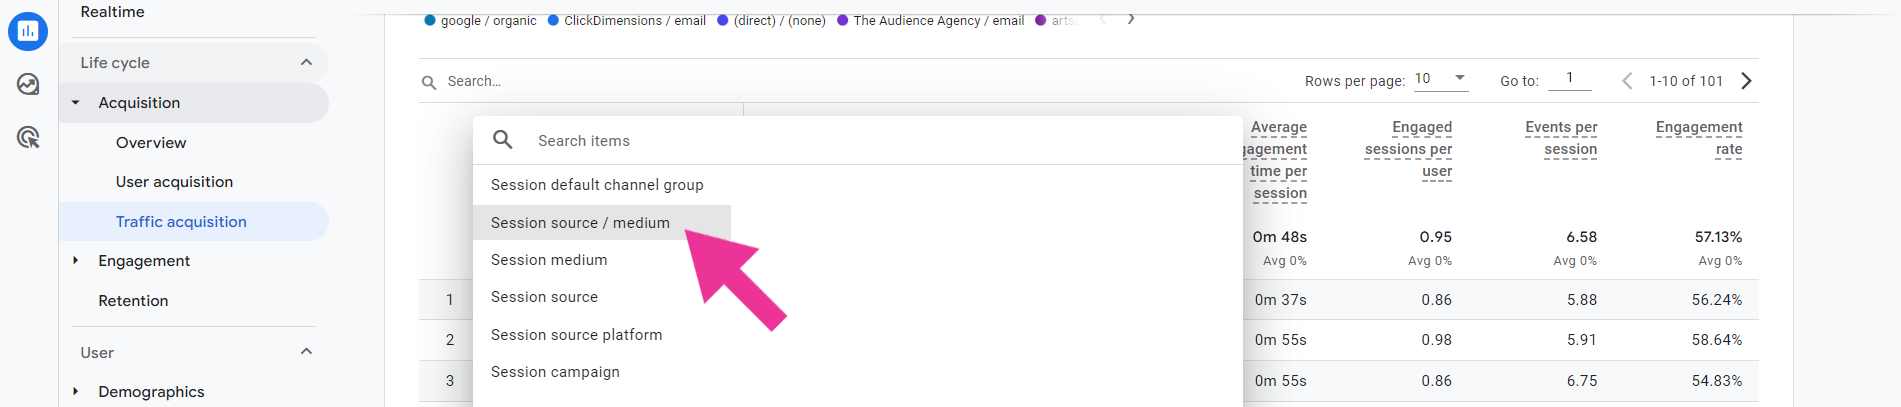
If we choose Session source / medium from the dropdown we can see a great level of detail about the sessions:
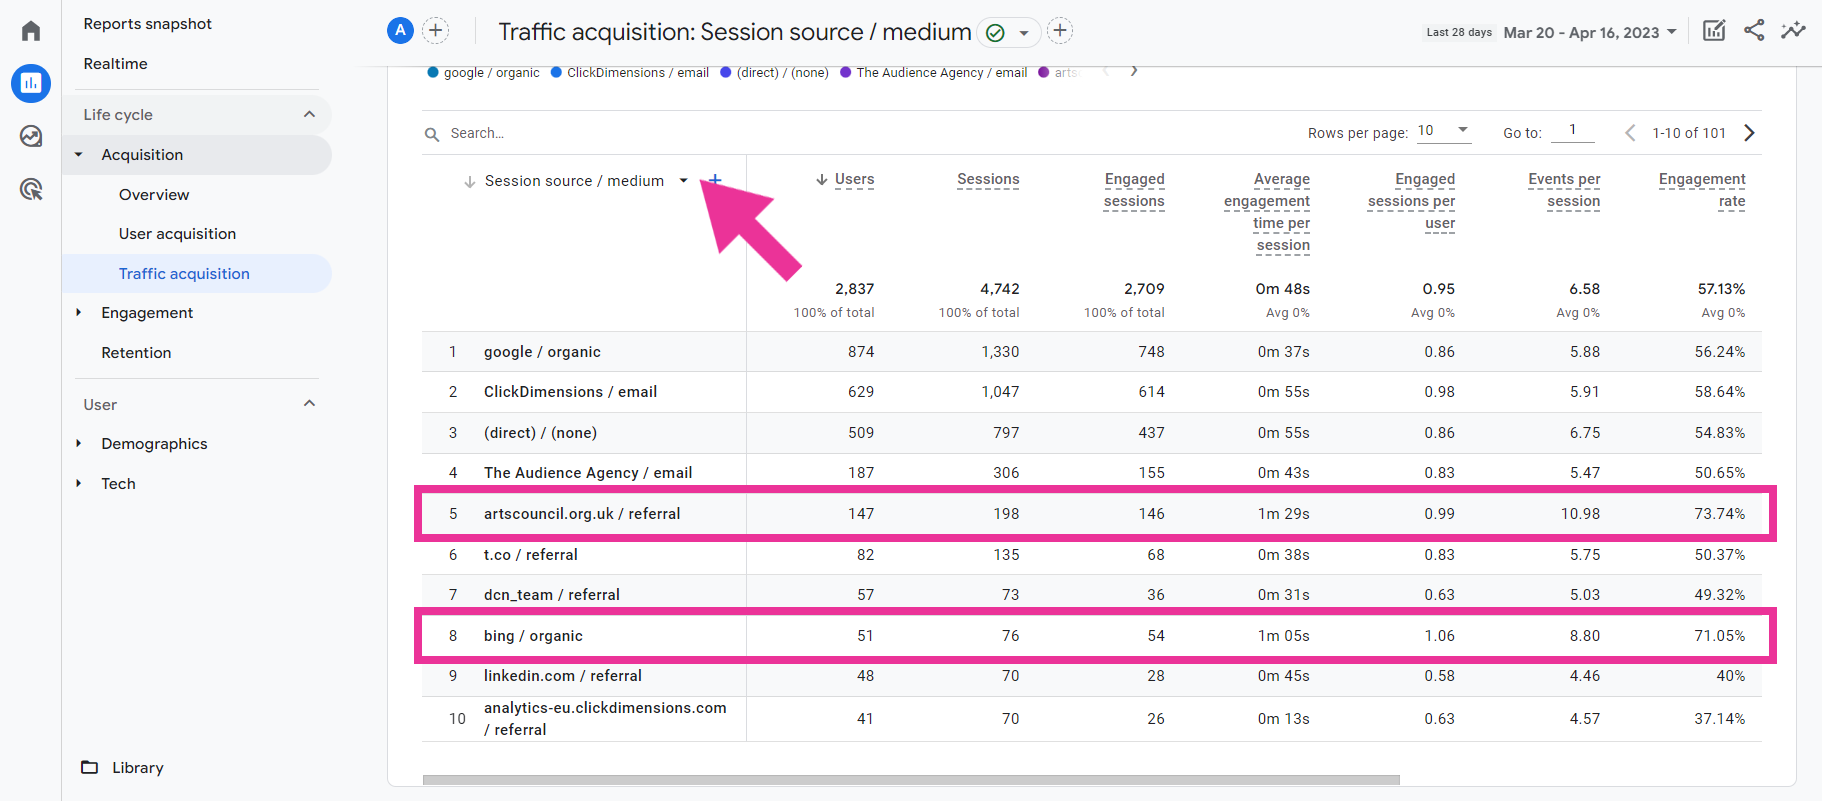
You can increase the rows per page at the top of the table, or click through the different pages of results. In the above example, we can see users who came from artscouncil.org.uk or Bing search spent a longer time on the website and completed more Events during each session compared to other channels.
Example report: Landing page
The landing page report uses two Events to calculate its results, page_view and session_start. When a new session to the website begins, GA4 will check if a page_view Event has fired and then pass through Parameters (such as where – the page_location, and what – the page_title).
This a great report for understanding how users are entering your website, not all of them navigate through your homepage.
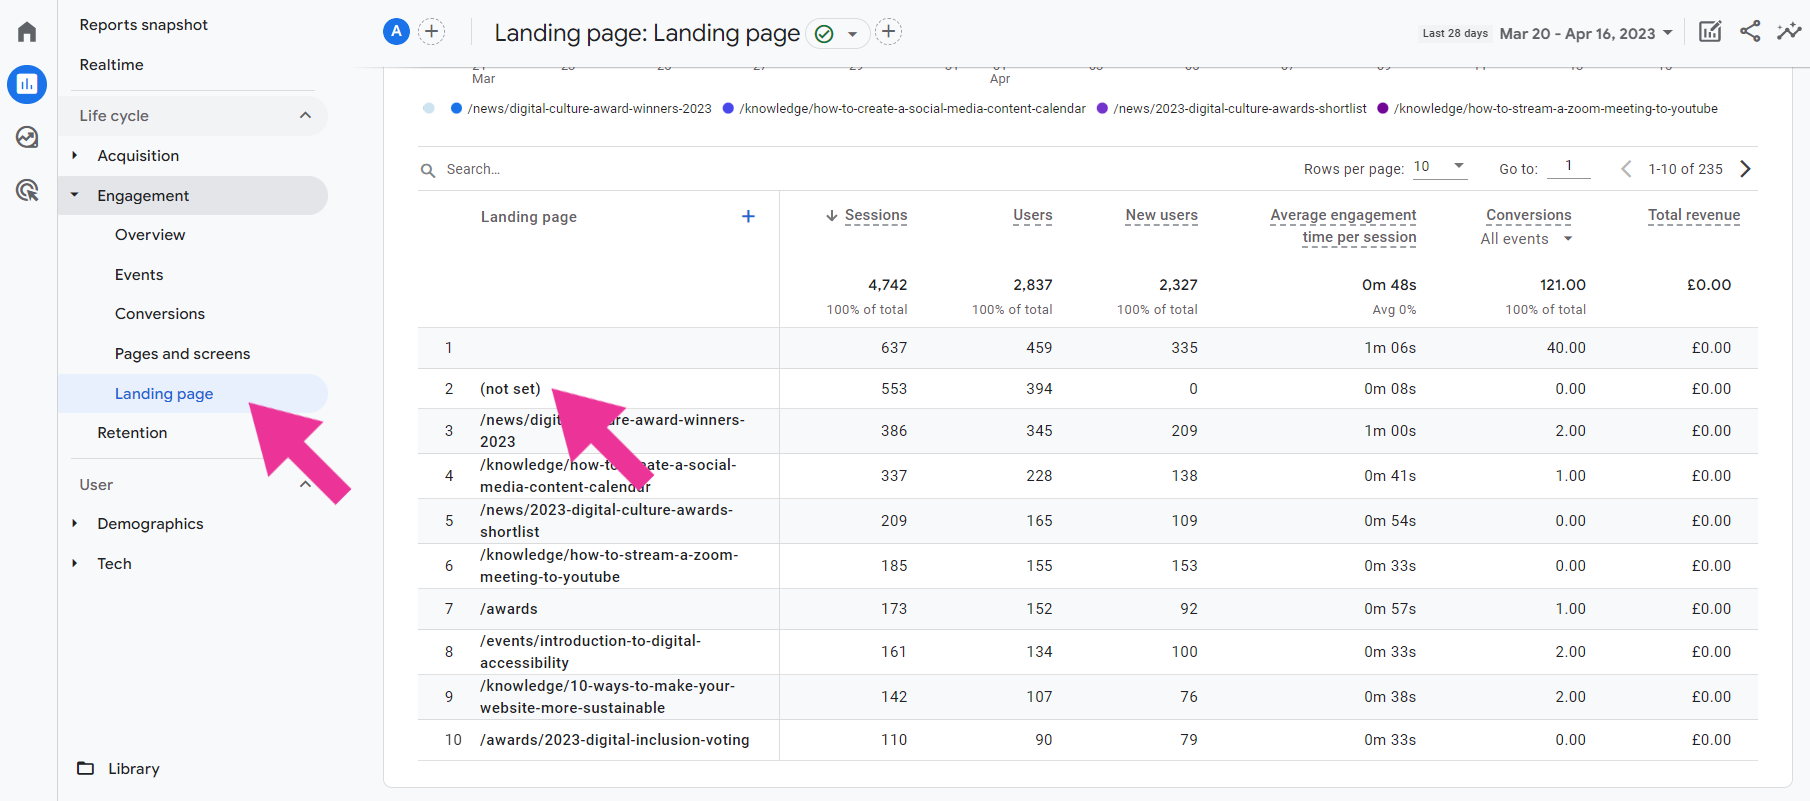
In the above example the first row has no information, this is the homepage of the website.
The second result in the table is (not set) with 0 New users. This occurs when a new session starts for a return User but no page_view Event was passed to GA4.
A likely example in many cases would be Users who have visited the website and opened other tabs in their browser. When they return to the tab much later, the original session has expired (after 30 minutes) so a new session begins. As the page was not reloaded, a new page_view Event was not sent.
Example report: Events
If you have an Engagement or Examine user behaviour collection, you will find a report for Events. This report outlines all the different Events which are being collected by your GA4 property.
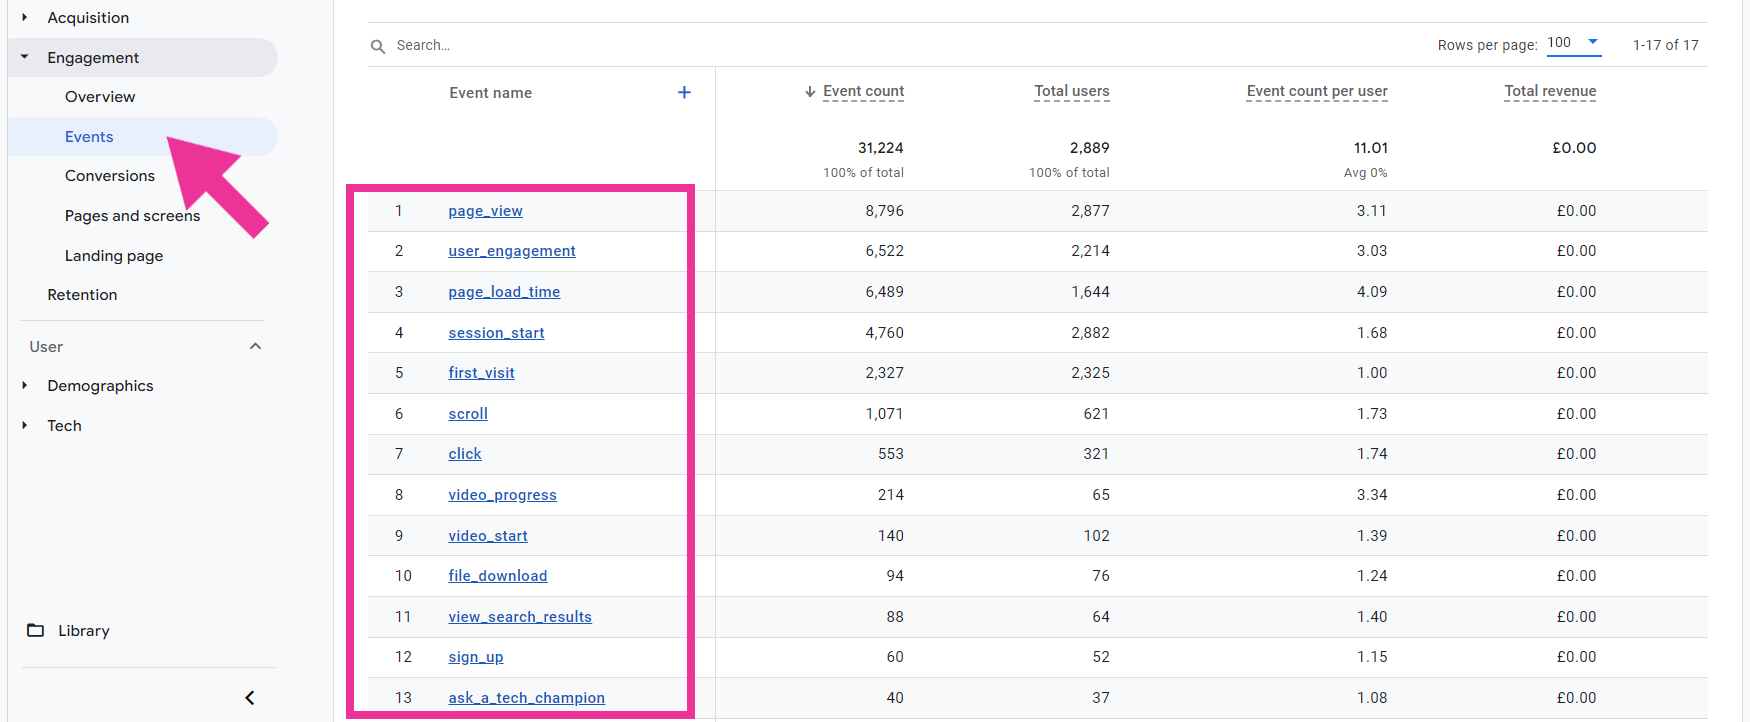
Each Event is clickable and will display a new report page with cards of information about the Parameters collected when the Event took place. For some Events, such as file_download, there is no further information about which files have been downloaded – something that would be really useful to know! That’s where the Explore section comes in, you can dig deeper into the data there.
Another place to view information about collected Events, create new ones and mark any as Conversions, is in the Admin section under Events. You can access the Admin section using the cog icon in the bottom left of the interface.
Comparisons
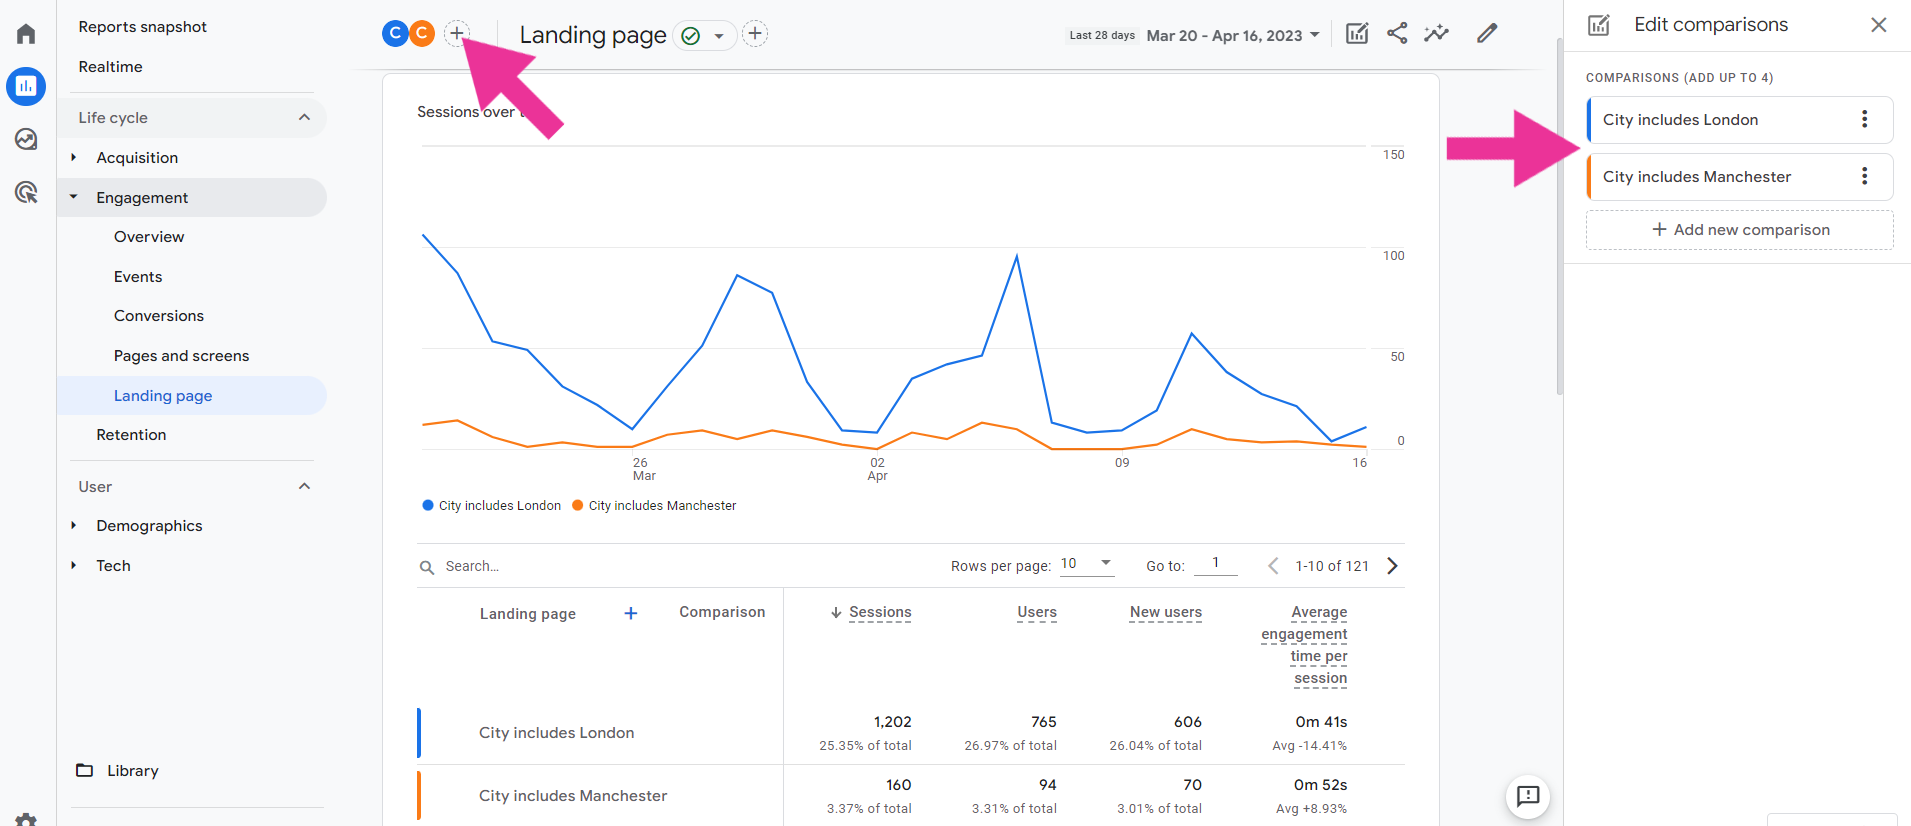
Another function in Reports is the ability to add Comparisons for any of the reports you are viewing. As standard it will display All Users, by clicking the plus icon next to the name of the report you can select up to five different comparisons to add, choosing the Dimension and value from the dropdown lists.
As an example we have selected a comparison between users in London and Manchester:
The Reports section allows you to view a range of data collected in your GA4 property, this may give you the information you need but if you want to dig deeper into the data or visualise it in a different way, you can use Explorations.
Comparisons can be converted into Segments to use in Explorations.
Explore section
In the Explore section you can create new reports with a range of dimensions and metrics which are auto-saved, exportable and shareable – these are called Explorations.
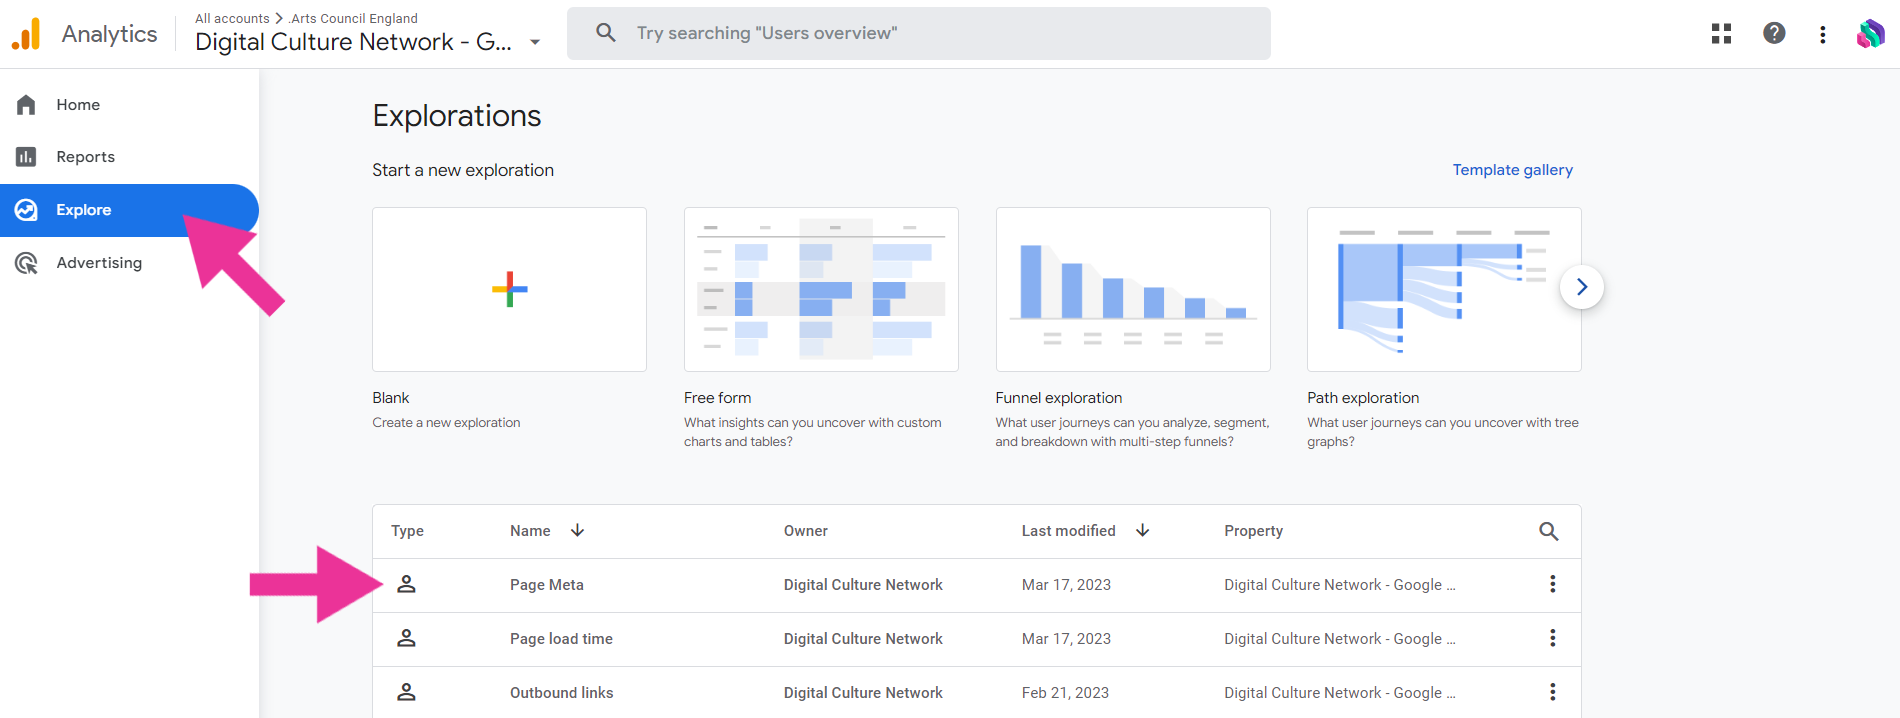
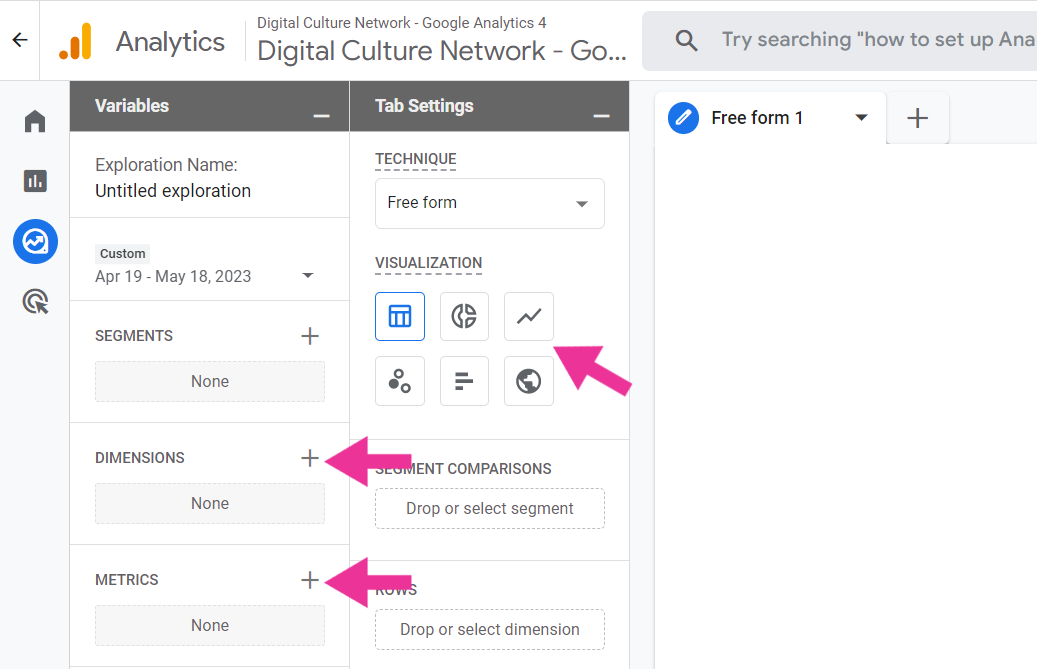
When creating a new exploration you pick the Dimensions and Metrics you want to report on and choose a type of visualisation to display the results.
Example report: File Downloads
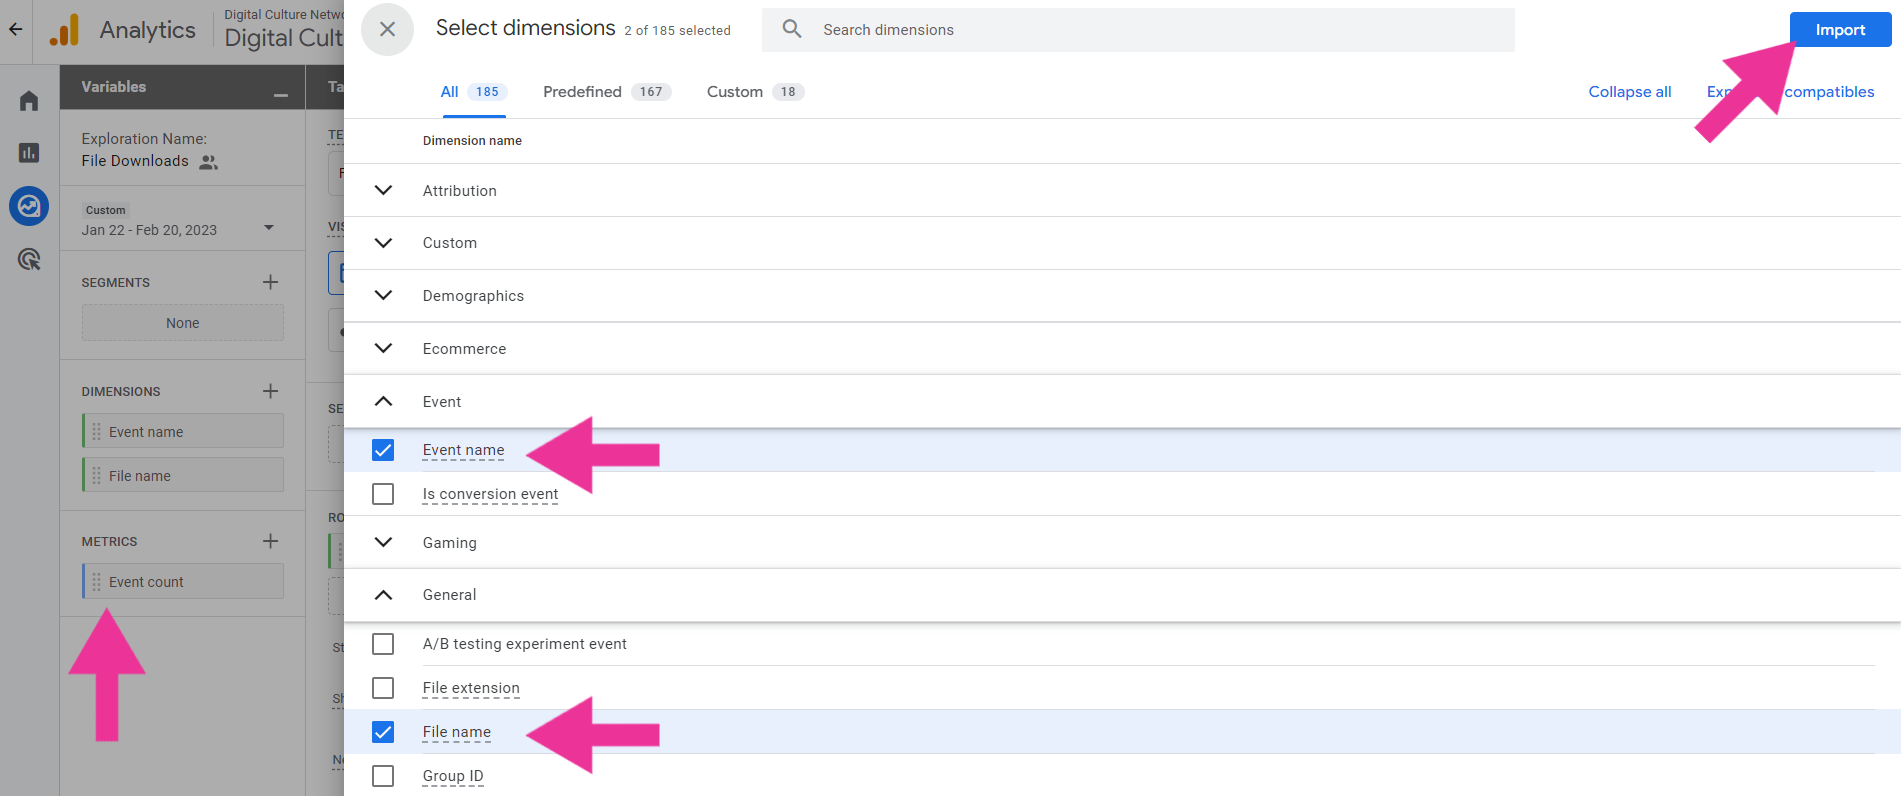
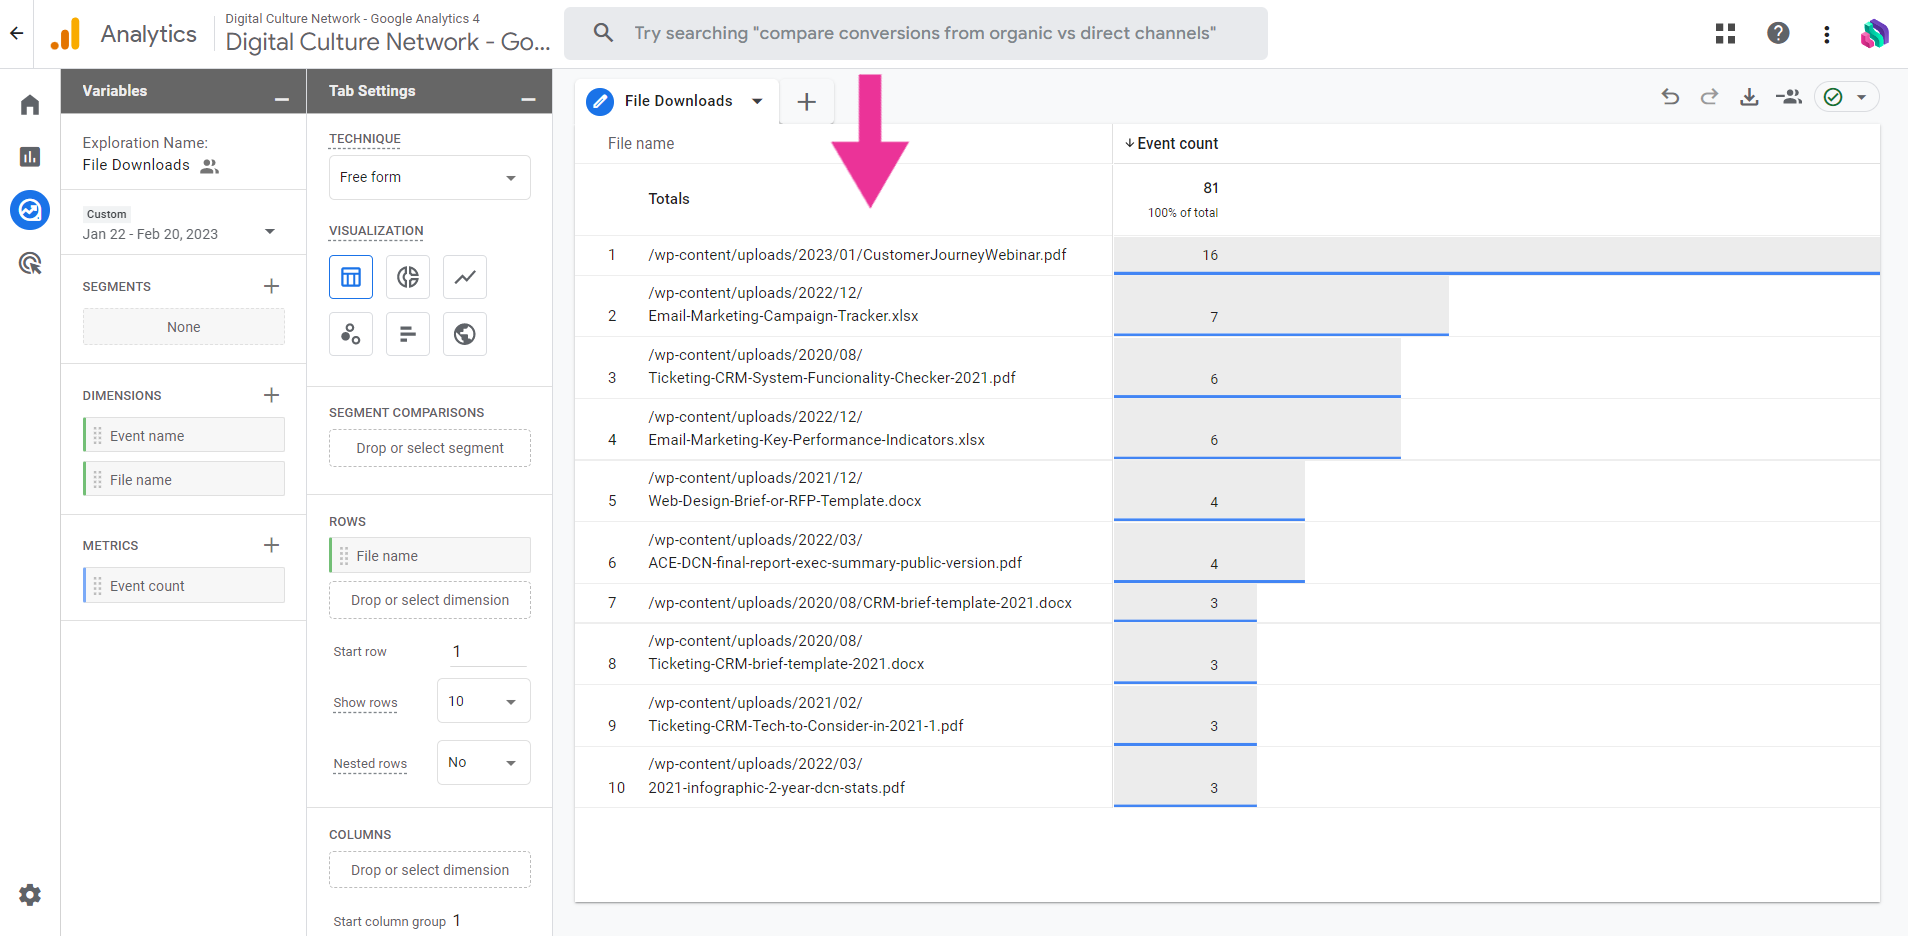
If we wanted to build an exploration of the file_download Event we would pick Event name and File name as Dimensions, and Event count as a Metric.
You can hover over any Dimension or Metric name to see a short explanation of what they mean.
We can drag File name and Event count over to the Tab Settings column to populate the table with results. To focus the report to only count file downloads (instead of all Events) we can add a filter at the bottom of the column so Event name exactly matches file_download.
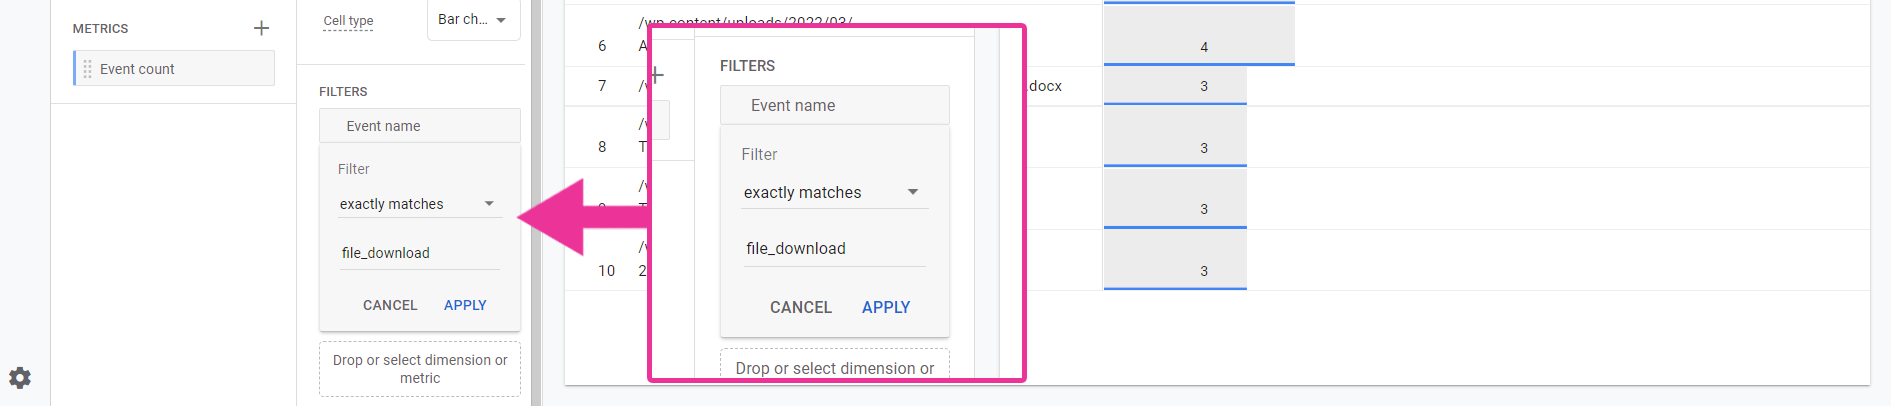
This will produce a report outlining which files have been downloaded in the given date range:
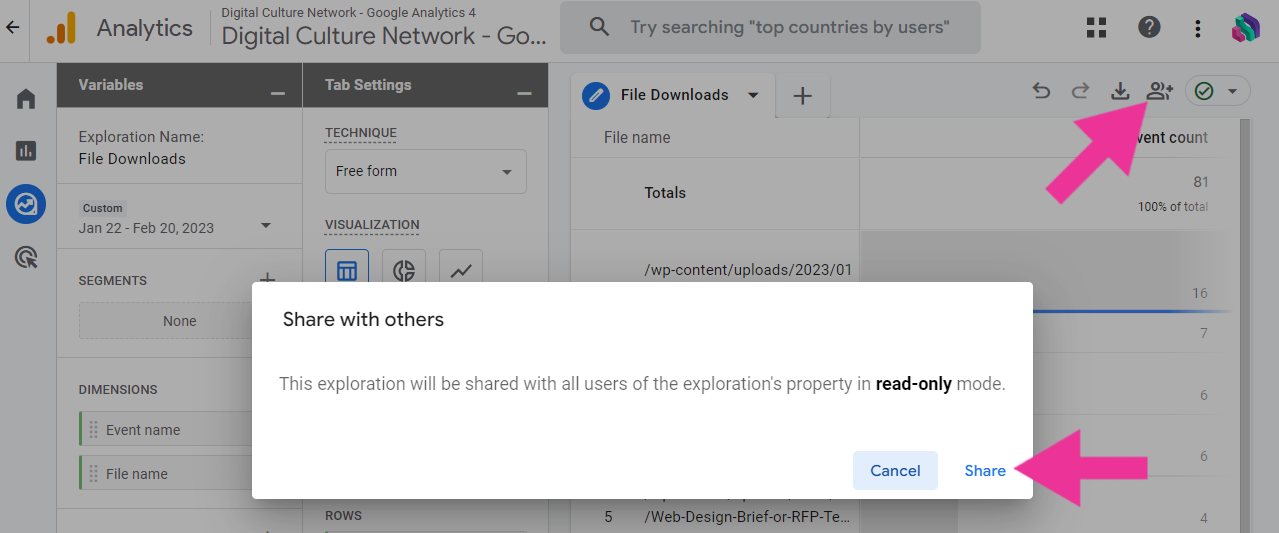
Explorations can be shared with other users who have access to the GA4 property by clicking the person icon in the top right. This sharing is limited in two ways:
- all users with access will be able to see the exploration, you cannot restrict who sees it, and
- the exploration is in read-only mode, they cannot change the date range, add segments, dimensions or metrics. They can make a copy of the report and then make changes to the new version.
There are a variety of exploration techniques and visualisation styles available in Explore. We recommend trying the different types against the data in your account, you cannot break anything and whatever you do here will not affect the raw data in your GA4 property.
Advertising section
The final section of the GA4 interface brings together advertising spend against any conversions you have defined to give you a return on ad spend. To make the most out of this section you must be using and have linked Google Ads to your GA4 account.
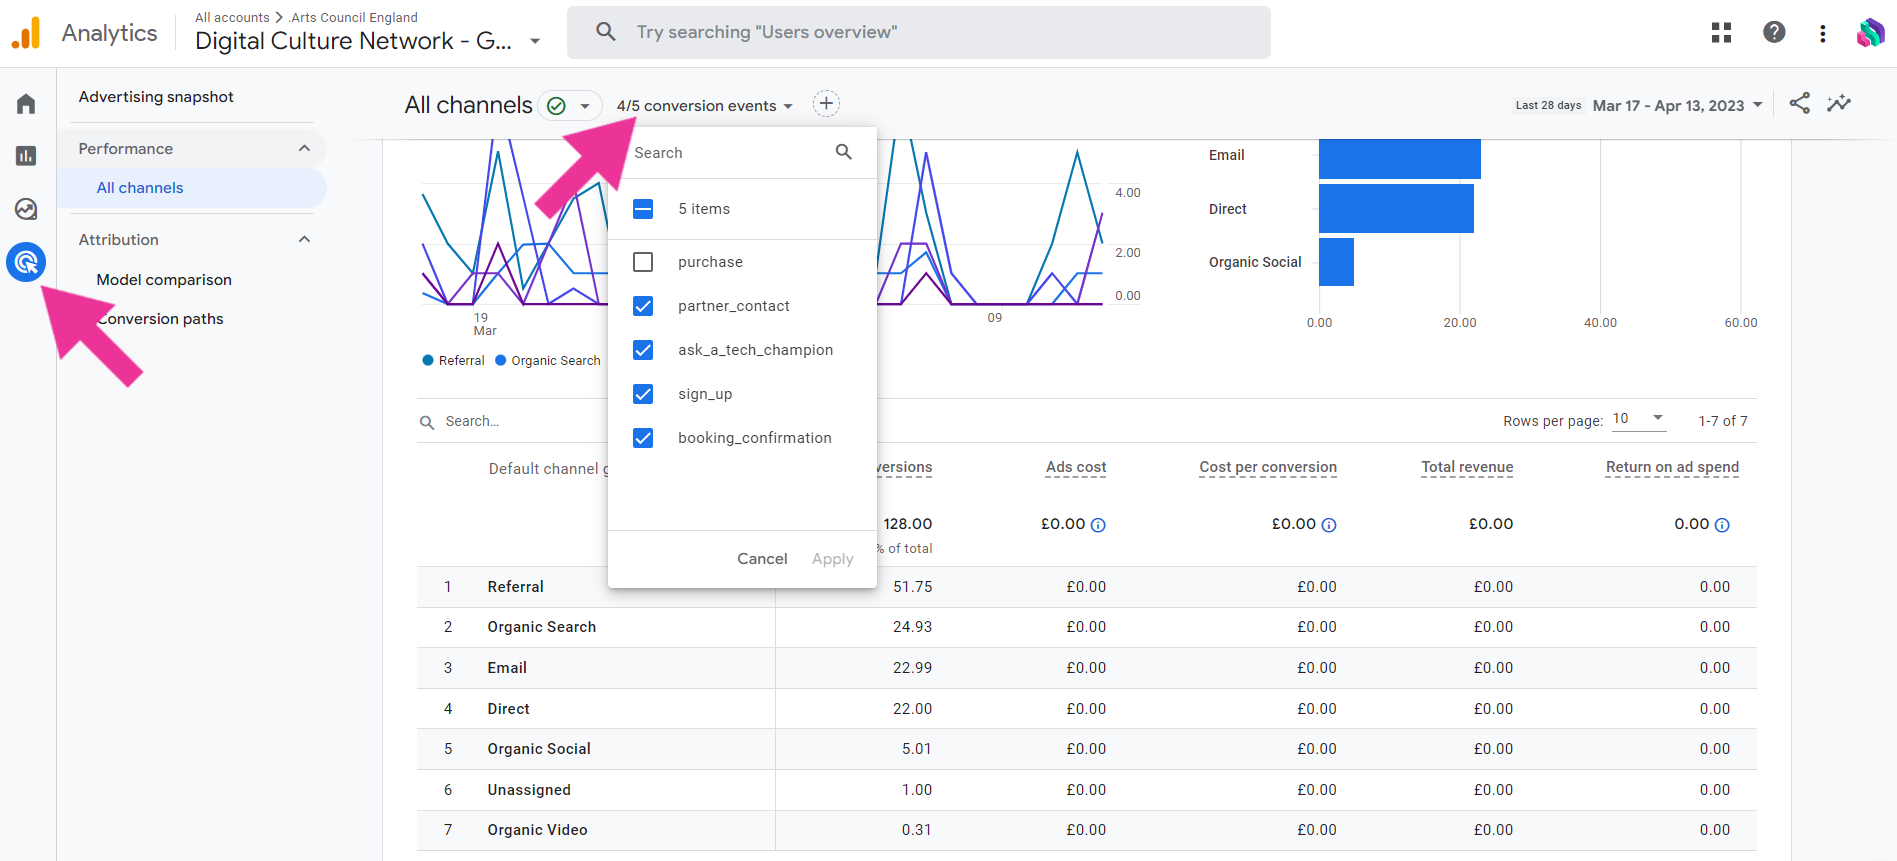
Although this presents some interesting data, this section seems underdeveloped by Google and not particularly useful for many cultural organisations. We’re hoping to see further development of this area or moving it to sit under the Reports section as a customisable Collection.
Further Support
The Digital Culture Network is here to support you and your organisation. Our Tech Champions can provide free 1-2-1 support to all arts and cultural organisations who are in receipt of, or eligible for, Arts Council England funding.
Need help or would like to chat with us about any of the advice we have covered above?
Request a free 1-2-1
To be the first to hear when new events are available and get the latest news from the Digital Culture Network, sign up for our newsletter below and follow us on Twitter @ace_dcn and LinkedIn for the latest updates.