How to automate your social media reporting
Do you spend a lot of time each month copying data or taking screenshots of your social media stats and pasting them into a report? Are you struggling to understand what is happening across your social media channels? Would you like to build an automated dashboard to save you time and help inform your activities?
In this article we explain three methods you can use to consolidate your data, save time, and tell your story.
Why is it useful to look at social media analytics?
Regularly monitoring your social media data can help you understand your audience behaviours, measure the performance of your content, and identify trends. This insight can guide the content you create and help improve the effectiveness of your campaigns.
What are the problems with social media analytics?
Before we jump into report building, it’s important to discuss the limitations of data from social media platforms and whether they are useful to you and your objectives.
Ever-changing measurement
Social platforms are continually evolving, adding new features, functionality and algorithm priorities. These lead to changes how metrics are defined, recorded and prioritised. The links below demonstrate recent changes:
If you are using these metrics for reporting, you need to keep up to date with any changes and communicate it as part of your reporting process. Our Social Media Tech Champions regularly share updates of this type on LinkedIn and through the Digital Culture Network newsletter.
Historical data limitations
Social platforms limit how far back you can look at past data. For example, TikTok restricts data to 60 days, X Premium only allows a 12-month look back window for top-level stats and 90 days for demographics and content related statistics. If you are not regularly saving or exporting your historical data, it severely limits your ability to understand things like follower growth and loss, along with other useful metrics.
Finding the right metrics
Social platforms provide a host of different metrics about the people who follow you and how your content performs. You’ll see engagement metrics (such as likes, shares and comments), view figures, and follower counts.
By looking at total follower counts for each of your platforms you get some indication of growth (or otherwise), but what story is it telling you about your audiences? If you want to understand what is working well and what is resonating with your audiences, are you looking at the right metrics?
A great starting point is to read this article from Digital Culture Network to understand why metrics like engagement and conversions can be more useful to you than impressions and followers : Which social metrics should you be paying attention to?
It will help you find the metrics most important to you and your objectives before you think about bringing them together into a report or data visualisation.
Where can I access my social media data?
Next, we look at what techniques you can use to collect and maintain data year-round:
Option 1: Use built-in analytics tools
Most social media platforms have built-in reporting tools with graphs, charts and tables of information about your followers and interactions with your content. You can download a Comma-Separated Values (CSV) file for use in a spreadsheet or other software or screenshot the report to save as an image for use in a report.
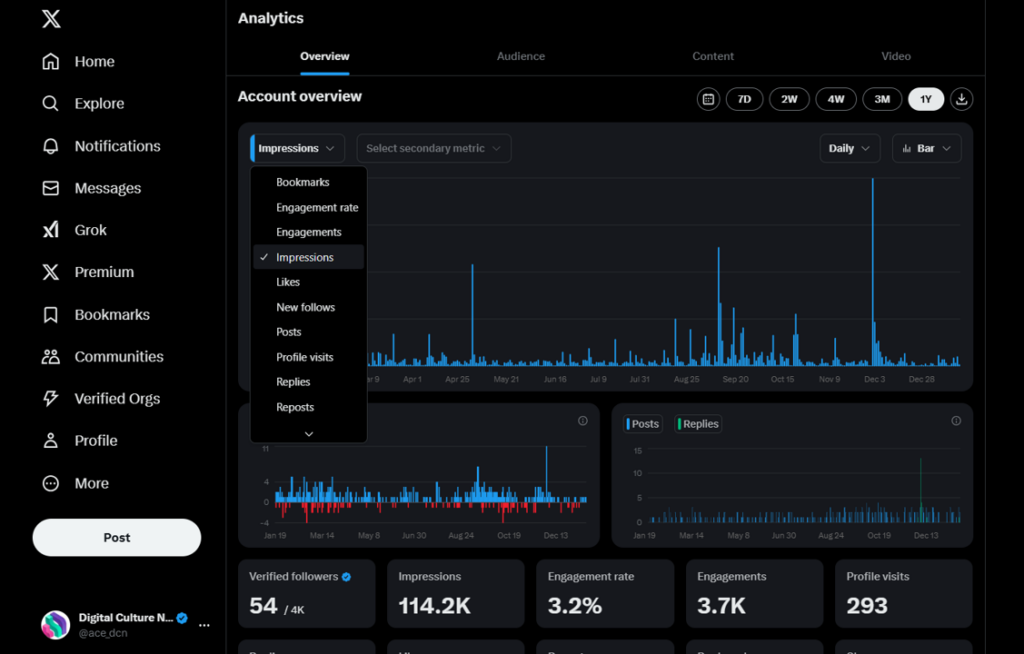
Example X Premium report
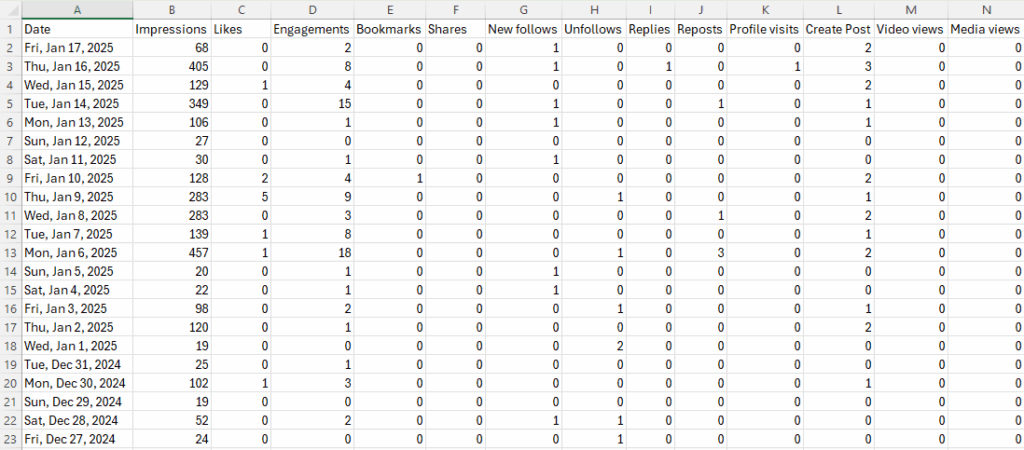
Example X Premium CSV export
A benefit of this method is zero cost, only your time each week or month to do this on a regular basis is required. You will also have ownership of a historical record of all your relevant metrics to look back on in the future.
Downsides:
This method requires you to manually go into each account on a regular basis and save the latest stats. If you are on annual leave is there someone to do this piece of work? If not, it may cause delays for the rest of your team.
Option 2: Use a Social Media scheduling tool
Tools like Hootsuite, Sprout Social, Loomly or Metricool have the functionality to aggregate data from your different social platforms and create reports to provide a holistic view of your activity.
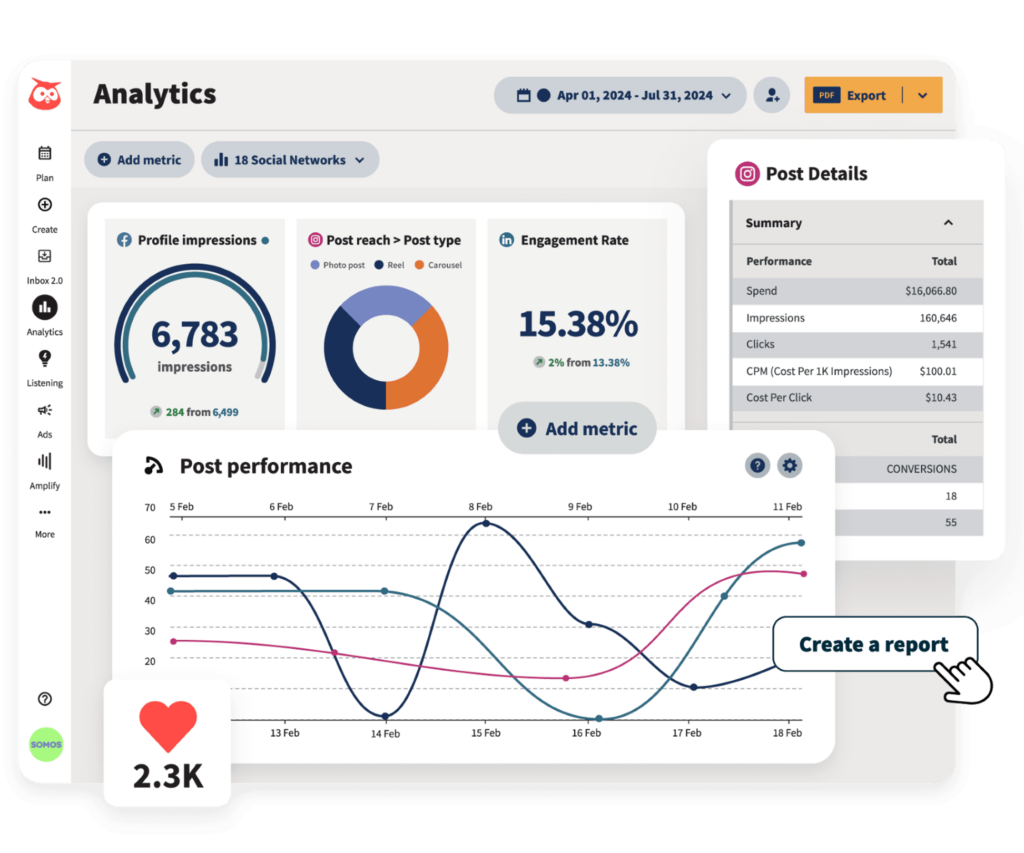
Example of Hootsuite’s analytics dashboard
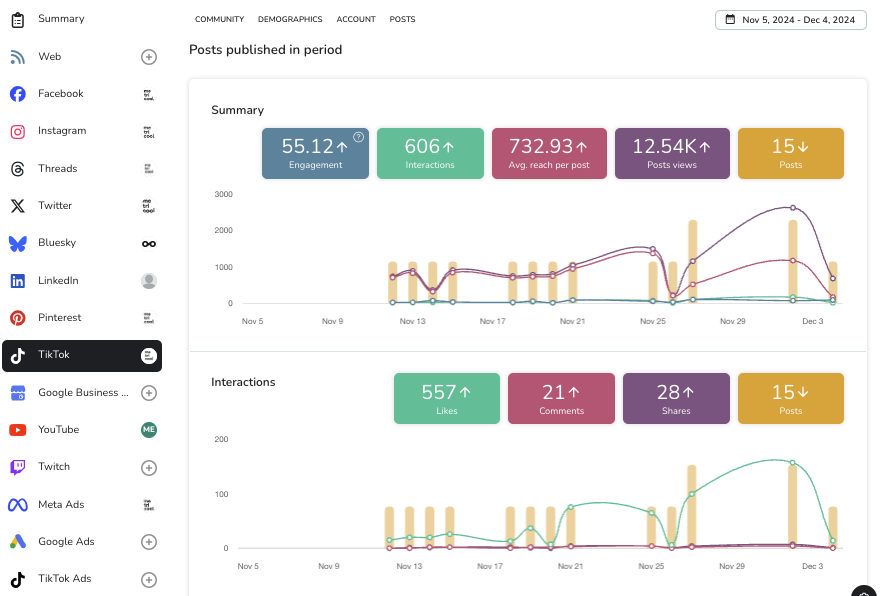
Example of Metricool’s analytics dashboard
A benefit of using a social scheduling tool for analytics is you can monitor the different types of content you create side-by-side. You may have organic (content you share by posting on the platforms for free), paid (content promoted through advertising), and earned (content created and shared by others).
Downsides:
- Social scheduling tools all require a paid subscription and there are limitations on getting the data out to use elsewhere (for example, Hootsuite requires an Enterprise plan to export CSV files).
- If you cancel the subscription at any point, you have no ongoing ownership of the dashboards or may have no ability to export the raw data.
Option 3: Use a data visualisation tool to build custom reports
Data visualisation tools such as Data Studio, Power BI and Tableau allow you to build a custom dashboard specifically for your needs, including interactive elements and custom branding.
Reports should highlight insights, not just display numbers without context. With platform-provided dashboards you are restricted to their fixed report layout and have no ability to add any contextual information. Whereas a custom data visualisation can include notes, recommendations and key takeaways to make the data you’re looking at become actionable for you and your team.
With full flexibility on the design and layout, you can create different reports for different stakeholders in and outside your organisation. For example, top-level summaries for senior leadership, and granular content performance for a marketing team.
Another benefit is data visualisation tools can include data from many different data sources, not just social media platforms, so you can build a holistic view across your online and offline activities.
Downsides:
- The initial setup and report building can take some time, with a steep learning curve. However, there are templates available, and the Digital Culture Network can help and develop your skills if you’d like to learn.
Making a choice
It’s worthwhile reviewing what might be the right fit for you and your team. There may be existing tools already in use in your organisation, or colleagues with experience of specific platforms.
With all options it’s easy to become overwhelmed with so much data available so it’s worthwhile reviewing what is useful to you and your team. Additionally, some graphs and charts can oversimplify data, leading to misinterpretation, so it’s important to dig deeper into the data behind the graphs to tell the full story.
How to build an automated dashboard for social media
For many organisations, taking control of your reporting and creating your own tailored, automated dashboard can be a useful long-term investment. If Option 3 is the right route for you, first decide on which data visualisation tool you’d like to use. Although there are some specific differences, most data visualisation tools offer the same set of options and functionality. Some require paid subscriptions and/or offer a free tier.
- Check if your organisation already has a subscription to a specific tool. For example, Power BI is sometimes included in the Microsoft 365 package
- Is there anyone with existing knowledge and skills using a platform already?
For the rest of the article we will discuss using Data Studio, a free visualisation tool from Google. The same outcomes are available with other tools, they just require different methods. You can access support from the Digital Culture Network, for free, to help with whichever one you choose.
Getting the data into your report
Automating your reports will save you time, improve data accuracy and can provide real-time insights. Depending on your budget and/or capacity, here are two options:
Option 1: Manually export the data
If you have zero budget, you can regularly export data from each platform and consolidate this into a computer-readable spreadsheet. If saved as a Google Sheet it can be configured as a data source, using the metrics and dimensions to build an interactive report.
You will need to commit to a defined process with regular set updates (monthly for example) to ensure the data is up to date. Although the data won’t be “live”, it is still a great way of consolidating data across multiple accounts into a sharable format.
Do consider how long it takes to perform these manual processes, try calculating the time it takes vs your hourly rate – it might be worthwhile investing in the cost of the next option.
Option 2: Using a connector or aggregator
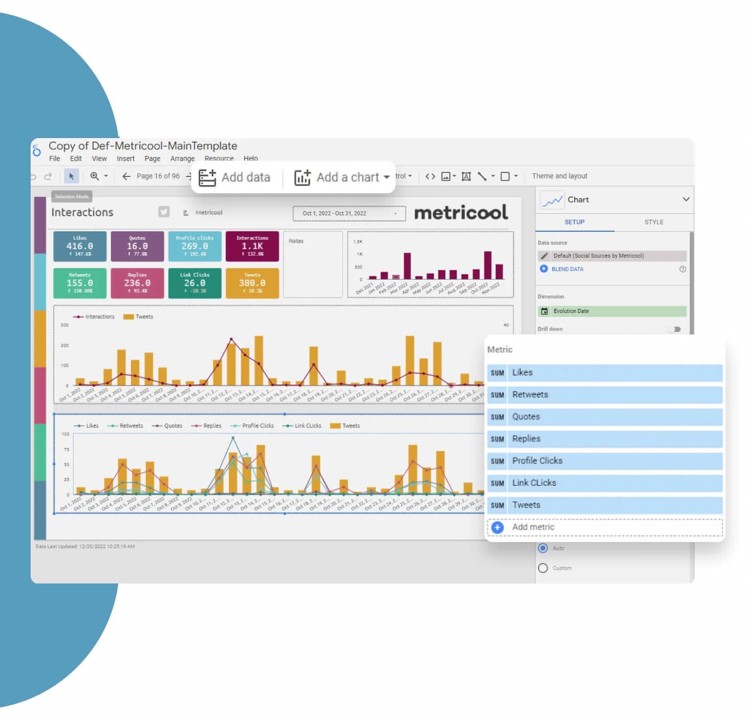
Services such as Funnel.io, Porter Metrics and Supermetrics are paid connectors. They pull data automatically from your chosen platforms and make it available to access directly in Data Studio.
Once it is set up, the live data feeds automatically into your reports, removing any manual data handling. It also means that report data is updated live, allowing you to check and respond to it more regularly, rather than waiting for periodic manual data handling. Reports can then be accessed by anyone in your team at any point and be sent via email on a scheduled basis.
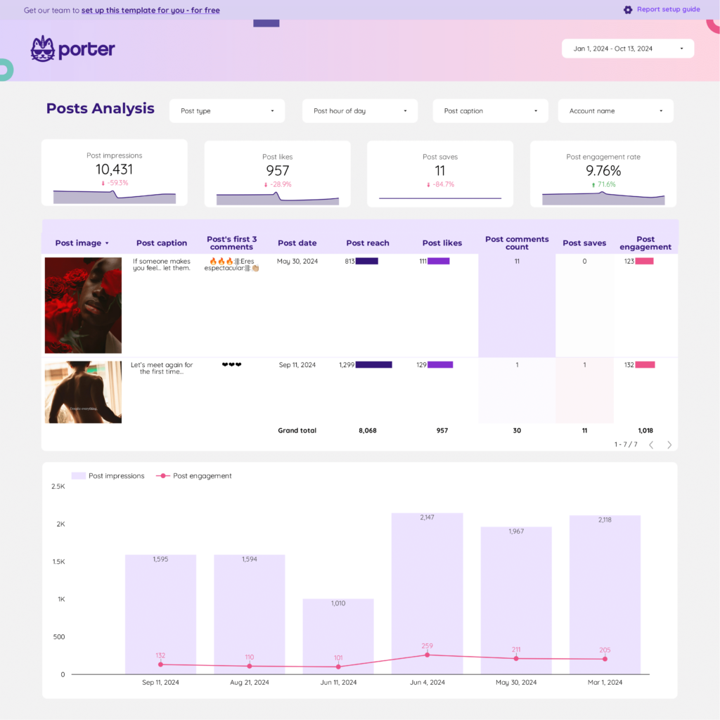
Example Instagram Insights report using Porter Metrics
Connectors can also save data to other places, such as Google Sheets or a database. By automatically saving your data using a connector, you have ownership and a permanent record. This enables you to access historical analytics beyond a platform’s date limitation and you have ownership of the metrics forever.
If you have large volumes of data, it can be sent to a cloud-based data warehouse, such as BigQuery, to store everything in one place. This in turn can be used as a data source in your visualisation platform.
Aside from the connector services listed above, explore the features of your existing tools. The social scheduling tool Metricool, for example, includes a Data Studio integration with its Advanced pricing tier.
I want to do this, what are the next steps?
Automating your social media reporting can save a significant amount of time and others in and outside your team understand what is effective and why it’s such an important channel for your marketing activities.
It can take a bit of trial and error to set a custom dashboard up, but here are some suggested actions to begin the process:
- Discuss what metrics are meaningful for your objectives
- Calculate the time currently needed to extract and present data of this type
- Review what systems and skills already exist in your organisation
As always, the Digital Culture Network is here to help you at any point in the process.
Further support
The Digital Culture Network is here to support you and your organisation. Our Tech Champions can provide free one-to-one support to all creative and cultural organisations who are in receipt of, or eligible for, Arts Council England funding. If you need help or would like to chat with us about any of the advice we have covered above, please get in touch. Sign up for our newsletter below and follow us on LinkedIn and X (Twitter) @ace_dcn for the latest updates.