Which social metrics should you be paying attention to?

Artsmark – Hillyfield Primary Academy
Photo @ The LPA, Xavier Fiddes / Hillyfield Primary Academy
If you work on social media, then it is likely that at some point you will be asked to pull together data to track your performance. There is a huge amount of data available for you to explore and download from each social platform which can make starting out feel overwhelming.
Alternatively, you might already be tracking social metrics, but looking at the same ones year on year, even though they do not reflect any of your organisational goals. So let us break down the metrics you should be tracking — the ones most important to your objectives.
Finding useful metrics on Social Media platforms.
Every social media platform has inbuilt analytics for you to explore.
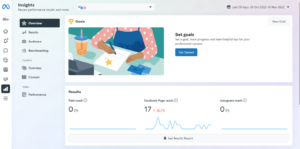
Meta Business Suite has Insights where you can find the data on your Facebook and Instagram accounts.
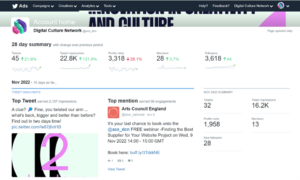
Twitter, LinkedIn, YouTube, Pinterest and TikTok all have their own in-built analytics.
If you are unable to find them then the likelihood is, you need to make your account a professional or business account to use them. Have a look at your settings to change this. With a professional account, you will also benefit from having access to data about your followers and additional functionality for businesses.
If you have got little to no budget for social media analytics, then there are free alternatives. One option is to download the data from each platform at the beginning of each month into an Excel spreadsheet to pull out key findings. Or, if you have got the money to invest in a social media analytics tool then there are lots of options that can save you time and energy. Buffer has got you covered either way, with this list of 27 free and paid social media analytics tools.
What do you want your social media to do?
The first thing to consider before identifying which metrics you want to track, is how they can tie in with your goals. Do you have a strategy and objectives in place? (If not, this article from Tech Champion Ollie can help)
Think about how your social media can help you to achieve these goals. Before you even get started with creating content you should be thinking about what you want your audience to actually do. For example;
- Are you trying to increase bookings to a show? If so, you probably want the audience to click through from your social media post to your website and book tickets, converting them into customers.
- Are you trying to raise awareness of your organisation? If so, you might want to increase the number of people seeing your posts (a metric called ‘reach’), post shares, and followers.
- Are you trying to build up a relationship with your audience to ensure they keep coming back? If so, it is likely you want your audience to engage with the post by encouraging them to react, comment, watch, save, or share.
There are lots of metrics to choose between, so identifying what you want to achieve is the best place to start.
You should also consider the strengths and weaknesses of the different platforms. For example, if you are focused on people clicking through to your website, then according to Social Insider the best platforms for your Click Through Rate are Facebook with 3.86% on average, followed by LinkedIn with 2.15%. Meanwhile, platforms like Instagram and TikTok are designed for audiences to linger on the app rather than leave it to follow link clicks.
Ok, now you know where to find the data and are thinking about what you want to achieve, let us dive into which metrics you will want to consider.
Everyone’s favourite, link clicks
Link clicks are the best metric for tracking whether you are driving traffic through to your website from your social media posts. If you are running ads with a traffic-driving objective, then you should also keep an eye on your Click Through Rate (CTR) and Cost Per Click (CPC).
It is worth noting however, that your link clicks probably will not match up with the social referral traffic you are seeing on Google Analytics exactly. There is always a discrepancy between the two, as they are both tracking data slightly differently. It is always worth looking at the two together to see a more realistic picture. This article from Ruler Analytics does a good job of explaining some of the reasons your data on Google Analytics may look different to your Meta results.
While link clicks are a tasty metric that most of us measure and review, we would warn against this being the only reason you are investing time and effort into social media. Lots of us are guilty of using social media as a broadcasting rather than an engagement platform, churning out posts with the sole purpose of drawing the audience to your website.
Social media algorithms by their very nature want users to stay on the platform, engaging with content. Your feeds need to be more than a selection of links in order to keep the audience engaging, returning, and crucially wanting to follow you. Some of your posts should focus on entertaining and informing the audience right there, on the platform.
Social media can do more for your organisation than just drive link clicks. It can be window to everything you are doing and can showcase what you have to offer the audience. It is the main way the audience learns about your organisation nowadays and one of the best ways to communicate directly with them. If you are focusing on engaging your audience and building up a relationship with them then they will remember you and keep coming back.
So while link clicks are an important metric, they are not necessarily the best in terms of your audience’s experience.
The unsung hero, engagement
We all know that engagement is something to aim for, but it often falls behind link clicks in terms of what we prioritise.
So, what do we mean when we are talking about engagement? Mostly we are talking about when the audience:
- responds emotionally – with reactions and likes
- responds verbally – with comments and replies
- passes it on to their followers – through shares, retweets, and reposts
- saves it for later – adding it to their saves, bookmarks, and favourites
Look at the total engagement for posts first and then at the breakdown of the above metrics to find out more about a post’s success.
Social media is all about engagement. The algorithms strive for it and prioritise posts with good engagement figures. If you are getting good engagement, then your content is resonating in some way with your audience. People are interested in talking with you and about you. You are developing a relationship, a social brand identity.
The science bit – if you want to work out the engagement rate percentage manually then this is the equation:
[the total engagements ÷ by the reach] x 100
Reach is a metric showing how many people engaged with your post. You may prefer to use impressions here instead of reach – either is fine for working out your engagement rate so long as you are consistent in which you choose.
When is an engagement less valuable?
Reactions are great and can show that a post has landed well with the audience, but they can be a bit misleading, if you are just looking at reactions as a number then two hundred angry faces will look the same as two hundred thumbs up! A comment is better because it will tell you a lot more about how the user engaged with the post. A share is better still as it lets you know that the post resonated so much with the viewer, they wanted to pass it on to others, which will increase your reach. A save is a very good indication that your content hit the spot and was valuable to that person.
Then there is the unfortunate fact that not all engagements are good engagements. Even with the best of intentions, your content will not always land the way you intended. It is a good idea to keep an eye on the engagement ratio of posts – if you are getting tons of comments or quote shares with very few likes then this could indicate that people are engaging negatively.
Let’s talk video views
If you are using video in posts then views will usually count towards your total engagement figures. Social media platforms break down video views in a variety of ways and some metrics are more useful than others.
If you are just going by total views then you are missing the bigger picture.
How long is a view? Depending on the platform, a view is usually 2 or 3 seconds long and counts even if your whole video is not showing on the screen. So, if your video is half in view at the bottom of someone’s Twitter feed and plays for 2 seconds that will still count as a view. That is why we pay less attention to total views and focus on more meaningful ones.
What is a Thruplay? Facebook launched this metric in 2018. Basically, a ThruPlay is when a user watches a video for either 15 seconds or until the end if it’s shorter than 15 seconds. 15 seconds is a better starting point for engaged viewers than 3 seconds.
Meta and Twitter break down your video view stats into percentages, which is helpful, as you can see where viewers are dropping off. Remember to work out your percentages into seconds so that you are not raving about how thousands of people watched 50% of what turns out to be a three second video though.
Assuming your video content is 20 seconds or longer, these percentage watched metrics are decent for showing engagement. And the gold standard metric that you can find across all platforms are video completions. These show the audience who liked the content enough to watch right until the end – a highly invested audience.
Hootsuite has made a handy breakdown of the different social video metrics by platform if you want more information on this topic.
Going deeper with conversions
If you are at the more advanced stage of your social media journey where you are working out tracking conversions then bravo! You are using the marketing funnel to make more meaningful relationships with your audience. (If you are new to the idea of a marketing funnel then check out James, the Tech Champion for Data Insight’s webinar ‘Why Are You Measuring That?’)
Some examples of conversions are when the user:
- Makes a purchase
- Donates
- Downloads an app or resource
- Signs up to your newsletter
- Books onto an event
Which of these conversions you choose to track depends entirely on your goals.
The science bit – a handy way to work out your conversion rate percentage is:
[Conversions ÷ link clicks] x 100
If you are looking to track conversions, you will want to set up social media Pixels to track users’ activities when they click through to your website. Pixels are essential for tracking paid advertising. You can set up Pixels for Meta, Twitter, LinkedIn (it’s called the Insight Tag), and even TikTok.
To set up Pixels you will need to add some code either via an integration manager or directly onto your website. There are multiple guides for setting up each platform’s Pixel on the web if you need assistance. For example, here is a guide from Social Media College on setting up your Meta Pixel.
Remember that Pixels act like cookies and therefore you need to make it clear in your data collection policies that you are using Pixels and which platforms you are using them on.
Showing customers you care
If you are an organisation or individual who has customers, then it is highly likely you are already using social media for customer service. Nowadays most people reach out to an organisation on social media in the first instance because it is easy and fast.
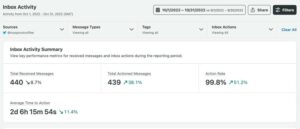
If this is the case for you then a couple of metrics to consider are your response rate and response time. Obviously the quicker the better in terms of dealing with customer issues or complaints.
Here is a screenshot from Sprout Social, which is one of the platforms where you can track metrics, including your response (or ‘action’) rate and response time (‘average time to action’).
Wait a minute, what about impressions and reach?
You might be surprised that we have left it until now to talk about these two mega metrics, but it is because they tend to overshadow some of the smaller and more impactful metrics by throwing huge numbers into the mix. Show these figures to your board or CEO and their eyes will light up – the possibility of thousands of new audience members is intoxicating. But the truth is if you are constantly chasing after these metrics you are likely to be disappointed.
Firstly, you need to be clear on the difference:
- Impressions – the number of times a post might have been seen
- Reach – the number of people a post might have been seen by
Why ‘might be seen’? Because people often ignore content. Just because it has been recorded as an impression, and someone’s view has been counted towards reach it does not necessarily mean your post was noticed. We are all swamped with content every day. Think about the last time you scrolled through social media – you will have seen adverts and posts by numerous organisations. Can you recall any of them?
It is still important to be aware of the reach and impressions a post gets as a measure of potential. A post with a high number of impressions and low engagement has missed its mark, and there is something to unpick there to understand why the audience did not engage with it.
A time when you will really notice these two metrics is if you are lucky enough to have a piece of content go viral (when it is rapidly shared and engaged with by a large number of users) – then you will see a surge in impressions alongside high engagement, and most of the reach will be non-followers.
One of the reasons why we put less emphasis on reach and impressions are algorithm changes. Social platforms are constantly being updated, tweaked, and fixed, and you can find this completely throws out these metrics. This is not your fault and putting too much emphasis on these figures can feel pretty disheartening. Part of working in social media is learning what works now, compared with yesterday, so cut yourself a break if your impressions and reach suddenly plummet out of nowhere, it is more than likely a tech update.
If you are running ads, then an important metric to keep an eye on is ad frequency. This metric shows the number of times a user is seeing your ad. If this number gets too high then the audience are likely to become fed up and start hiding the ad or even worse, blocking you. The sweet spot for ad frequency is usually less than 3-4. Any more than that and you need to start looking at your targeting and working out why the ad is only being shown to a limited number of people repeatedly.
Give them a reason to follow you
At the Digital Culture Network, we would always suggest that you track your followers and keep an eye on your audience growth rate.
Now for the science part – To work this percentage out, it is:
[Number of new followers ÷ total followers] x 100.
Growing your followers is a hard metric to aim for, which is why I have left it until last. On some platforms, like Facebook, the only way you are really going to get anywhere with growing your audience significantly is by putting money into advertising. On others, like TikTok, you can have a surge in new followers when a post goes viral.
The main thing with this metric is to look at it as a long-term, slow and steady goal, on the platforms where you most want to attract an audience. You are never going to get a surge in followers just from posting links to your website. People follow accounts that entertain and inform them. They will follow if they enjoy seeing your content and want to see more of it. So, what can you show them that will bring them joy or spark their interest? Take your audience on a journey. Give them a reason to return.
And watch for unfollows. You can usually track when people unfollowed or even the post that made them unfollow. Did it cause offence? Do you stand by the content? Sometimes a drop in followers is not a negative thing, for example, if you are taking a stance on an issue then you may lose followers who disagree.
Sometimes you will lose a big chunk of followers when there is a cull on spammers and bots. This often happens on platforms like Twitter.
TL; DR, just give me the takeaways!
In conclusion, the metrics you are tracking should really depend on your strategy and objectives. Once you have worked these out you should assign corresponding metrics to your goals.
If you are not sure where to start then your bread-and-butter metrics that are going to give you some insights are engagement (including the different kinds – shares, comments, views, etc), link clicks and reach.
In terms of how those numbers should be performing, while it is tempting to look up average percentages and compare yourself with others, the best organisation to compare your stats with is your own organisation! How have you performed in the past? Going forward how are you performing month on month? Have a look at your average monthly performance and keep these figures as your benchmark stats to grow on. How is your performance changing monthly and quarterly? This is honestly a better way to see your KPIs develop and grow.
And when you have a top performing post save a link to it. Objectively look at it, why did it work? Was it the subject? Was it newsworthy? Conversational? Did it have a really clear call to action? Was the visual exciting? Did it make the audience feel good? Make note and learn from your successes and failures.
Social media is all about trying new things, testing what works, and growing from it.
In this article we have covered key social media metrics and recommended next steps. If you are keen to learn more or need help with any of the steps, check out the links below.
What’s next?
The Digital Culture Network is here to support you or your organisation. Our Tech Champions can provide free 1-2-1 support to all creative and cultural individuals and organisations who are in receipt of, or eligible for, Arts Council England funding. If you need help or would like to chat with us about any of the advice we have covered above, please get in touch. Sign up to our newsletter below and follow us on Twitter @ace_dcn and LinkedIn for the latest updates.